
1. Introduction
Among the many types of threats that occur during the battles of surface ships, the underwater explosion (UNDEX) causes structural and equipment damages and the even loss of the longitudinal strength of naval vessels. Therefore, in order to continue the battle and operational performance of naval ships, the shock-resistance against the UNDEX must be evaluated throughout the exploratory development stage and system development stage, respectively.
Naval ships are composed of hull structure, equipment, and crews. The shock-resistance evaluation is performed mainly on the most vulnerable installations and equipments. The shock-resistance responses for those installations and equipments are evaluated using experimental and numerical approaches. In general, the experimental method is recommended, but if there are experimental restrictions, such as the huge sizes, excessively heavy weights, and high costs, the computer-based numerical approach can be an alternative (BV, 1985).
The numerical approach includes the static acceleration method, the dynamic design analysis method (DDAM) suggested by the U.S. Naval Research Laboratory (NRL), and the BV043 method by the German Naval Regulations (BV, 1985).
Although the static acceleration method is relatively simple compared to other numerical methods, the Naval Sea System Command (NAVSEA) does not recommend to use it because it does not consider the dynamic responses. The DDAM evaluates the shock-resistances based on the spectral analyses (NAVSEA, 1995). The shock response spectrum (SRS) can be calculated using the BV043 based on the German Naval Regulations while the BV043 also provides the design criteria for the SRS. The BV043 provides guides to calculate the SRS depending on the installation locations of the equipments and the shock directions.
Lee and Choung (2020) confirmed that the fluid domain was not necessary condition to obtain the response history of the floating body subjected to the UNDEX loads. Kim et al. (2021) performed the inelastic whipping response analyses at the various stand-off distances using Timoshenko beam elements. Lee et al. (2010) applied the DDAM to analyze the shock responses of the large motors. Lee (2012) performed the shock-resistance response analyses of the ship steering system using the DDAM. Bae et al. (2009) and Seong et al. (2015) applied the BV043 to analyze the shock responses for the propulsion motor. Kim et al. (2017) evaluated the shock-resistance performance of the gas turbine package using the BV043.
As can be seen from the reference surveys, the DDAM and BV043 methods have been used extensively to evaluate the shock-resistance performances of the equipments on naval ships.
After analyzing the 3-dimensional (3D) full ship shock responses, it is possible to evaluate the design integrity of the hull structures and equipment support structures. However, in the case of 3D full ship shock response analyses, it takes a considerable amount of time, hence it is often not possible to perform 3D full ship shock response analyses in the exploratory development stage. Therefore, the goal of this study was to check if the 1-dimensional (1D) shock response analysis model presents the reliable shock-resistance responses at the equipment supports.
The pseudo-velocity shock response spectrum (PVSS) obtained from the 1D shock response analysis (1D-PVSS) was compared with the PVSS of the 3D model (3D-PVSS). The 1D-PVSS was compared with the BV043 shock-resistance criteria. The effectiveness of the 1D model and the 1D-PVSS were validated.
2. Technical Background
2.1 UNDEX Model
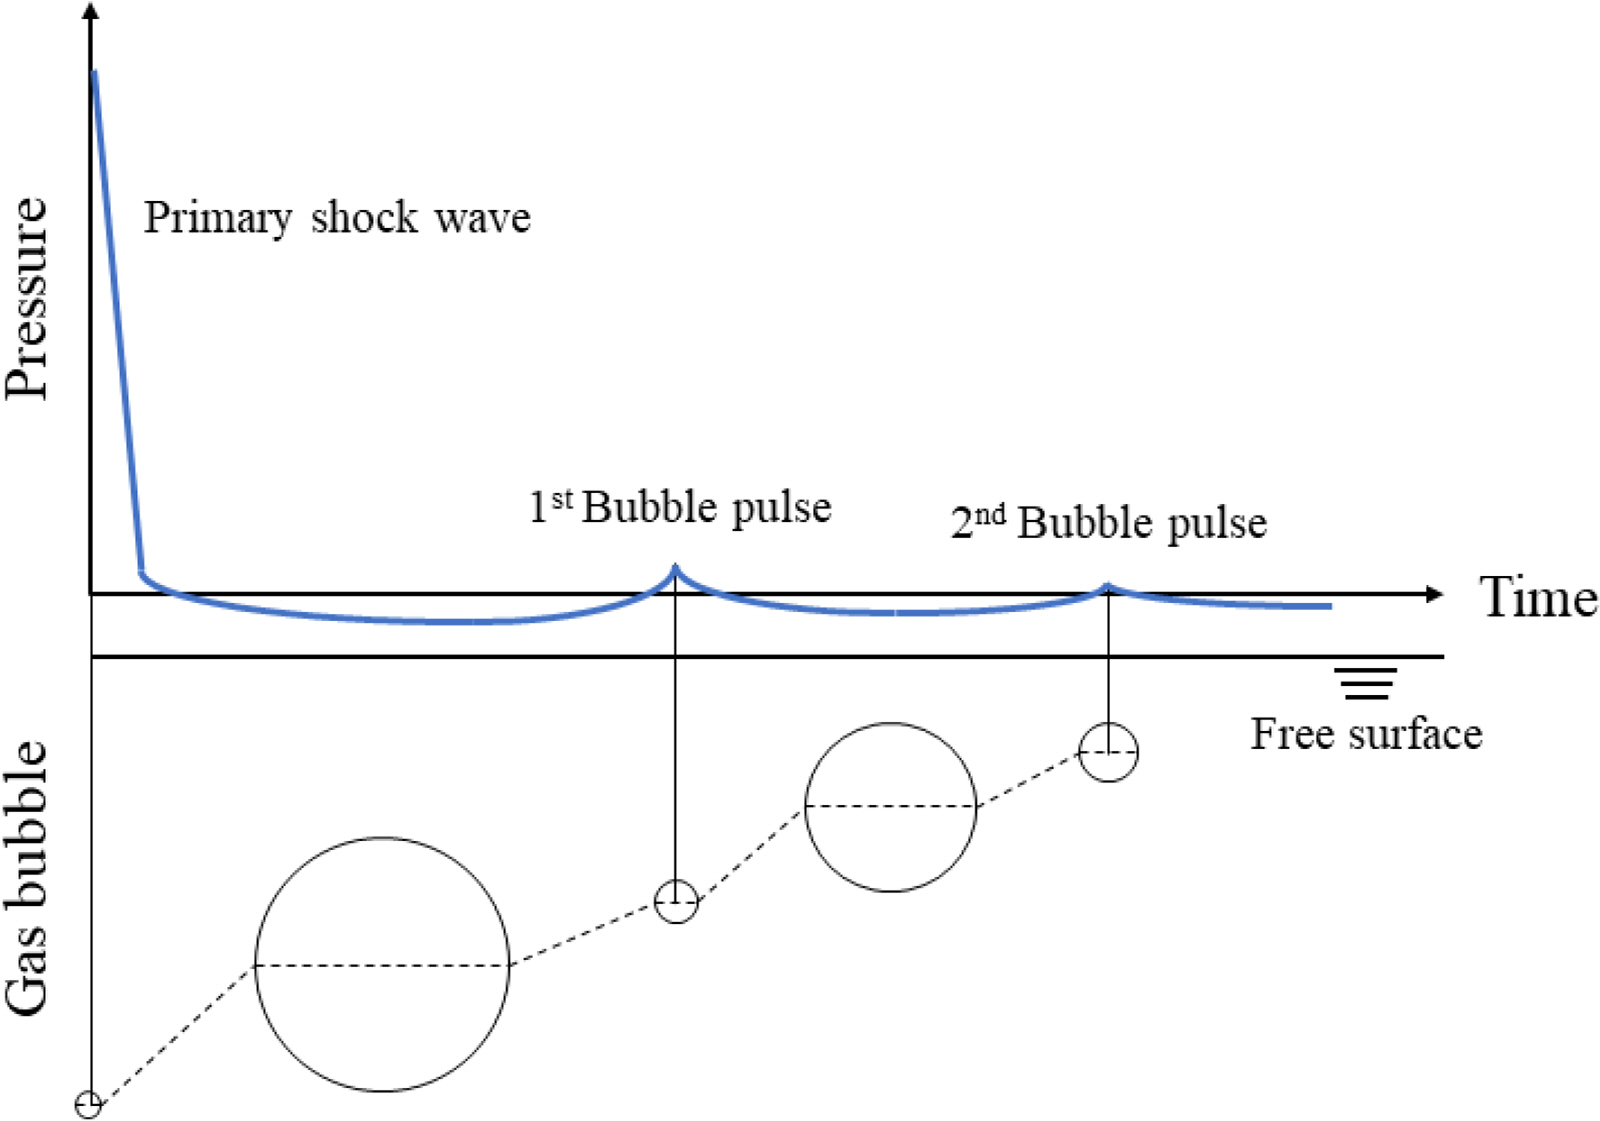
When an explosion occurs in water, a primary shock wave faster than the speed of sound in water propagates from the source point, and a spherical gas bubble migrates to surface of the water, expanding and contracting repeatedly. Every time the gas bubble contracts to its minimum value, it spreads the strongest bubble pulse. (See Fig. 1.)
Geers and Hunter (2002) presented an UNDEX model that can consider the primary shock wave and the gas bubble wave in a single The primary shock wave given in Eq. (1) that is a function of time t and stand-off distance R where the gas bubble volume acceleration V┬© is presented in Eq. (2).
Geers and Hunter (2002) presented an of motion with the radius, a, and vertical upward migration, u, of a gas bubble based on the doubly asymptotic approximation (DAA). The rates of the radius change and vertical displacement are given by Eqs. (3) and (4), respectively. In order to calculate the radius of the gas bubble and its migration, Eqs. (3) and (4) should be integrated with the seven initial conditions at tI = 7Tc. By integrating Eq. (2), the first condition of the initial radius of the gas bubble and second condition of the initial radial velocity of the gas bubble can be obtained. i.e., a(tI ) = aI = V╠ć(tI)/4ŽĆa2(tI) and a╠ć(tI) = a╠ćI = V╠ć(tI)/4ŽĆa2 (tI ), respectively.
By combining Eqs. (3) and (5), the third condition, Žål0 (tI), that is shown in Eq. (8) can be obtained. Similarly, Eqs. (4) and (7) produce the fourth condition of Žåg1 (tI), as given in Eq. (9). The fifth and sixth conditions are the initial location u(tI )= 0 and the initial velocity u╠ć(tI) = 0. The last condition corresponds to the fluid potential Žål1(tI) = 1/2(g/cl)aI2.
Žål0: fluid velocity potential corresp. to 3rd initial condition
Žål1: fluid velocity potential corresp. to 4th initial condition
cl: the speed of sound in the fluid
Žåg1 : gas bubble potential
Žüg : gas bubble density
Pg: gas bubble pressure constant (=Kc(Vc/V)╬│)
Vc: initial volume of the gas bubble
V : volume of gas the bubble
╬│ : specific heat ratio of the gas bubble
╬Č: impedance ratio (=Žügcg/Žülcl)
Kc: adiabatic pressure constant
tI: initial time
pI: initial pressure at the source point (=patm + ŽülgdI)
dI: initial depth of charge mass
patm: atmospheric pressure
g : gravitational constant0
The primary shock generated at the source point applies the impulsive pressure to the hull surface, while the bubble pressure field over space and time is estimated using the DAA model of Eq. (10). As shown in Eq. (11), the spatial pressure term, PR, is determined using the stand-off distance, R, of Eq. (13), where xs and xc are the coordinates of the stand-off and charge points, respectively. The time pressure term, Pt, should be distinguished by the shock phases: the primary shock wave (tI Ōē”7Tc) and the gas bubble wave (tI >7Tc). The charge constants are far smaller than unity, thus the stand-off distance has a minor effect for the primary shock wave phase, thus the stand-off distance may be often assumed to be constant.
2.2 Definition of PVSS
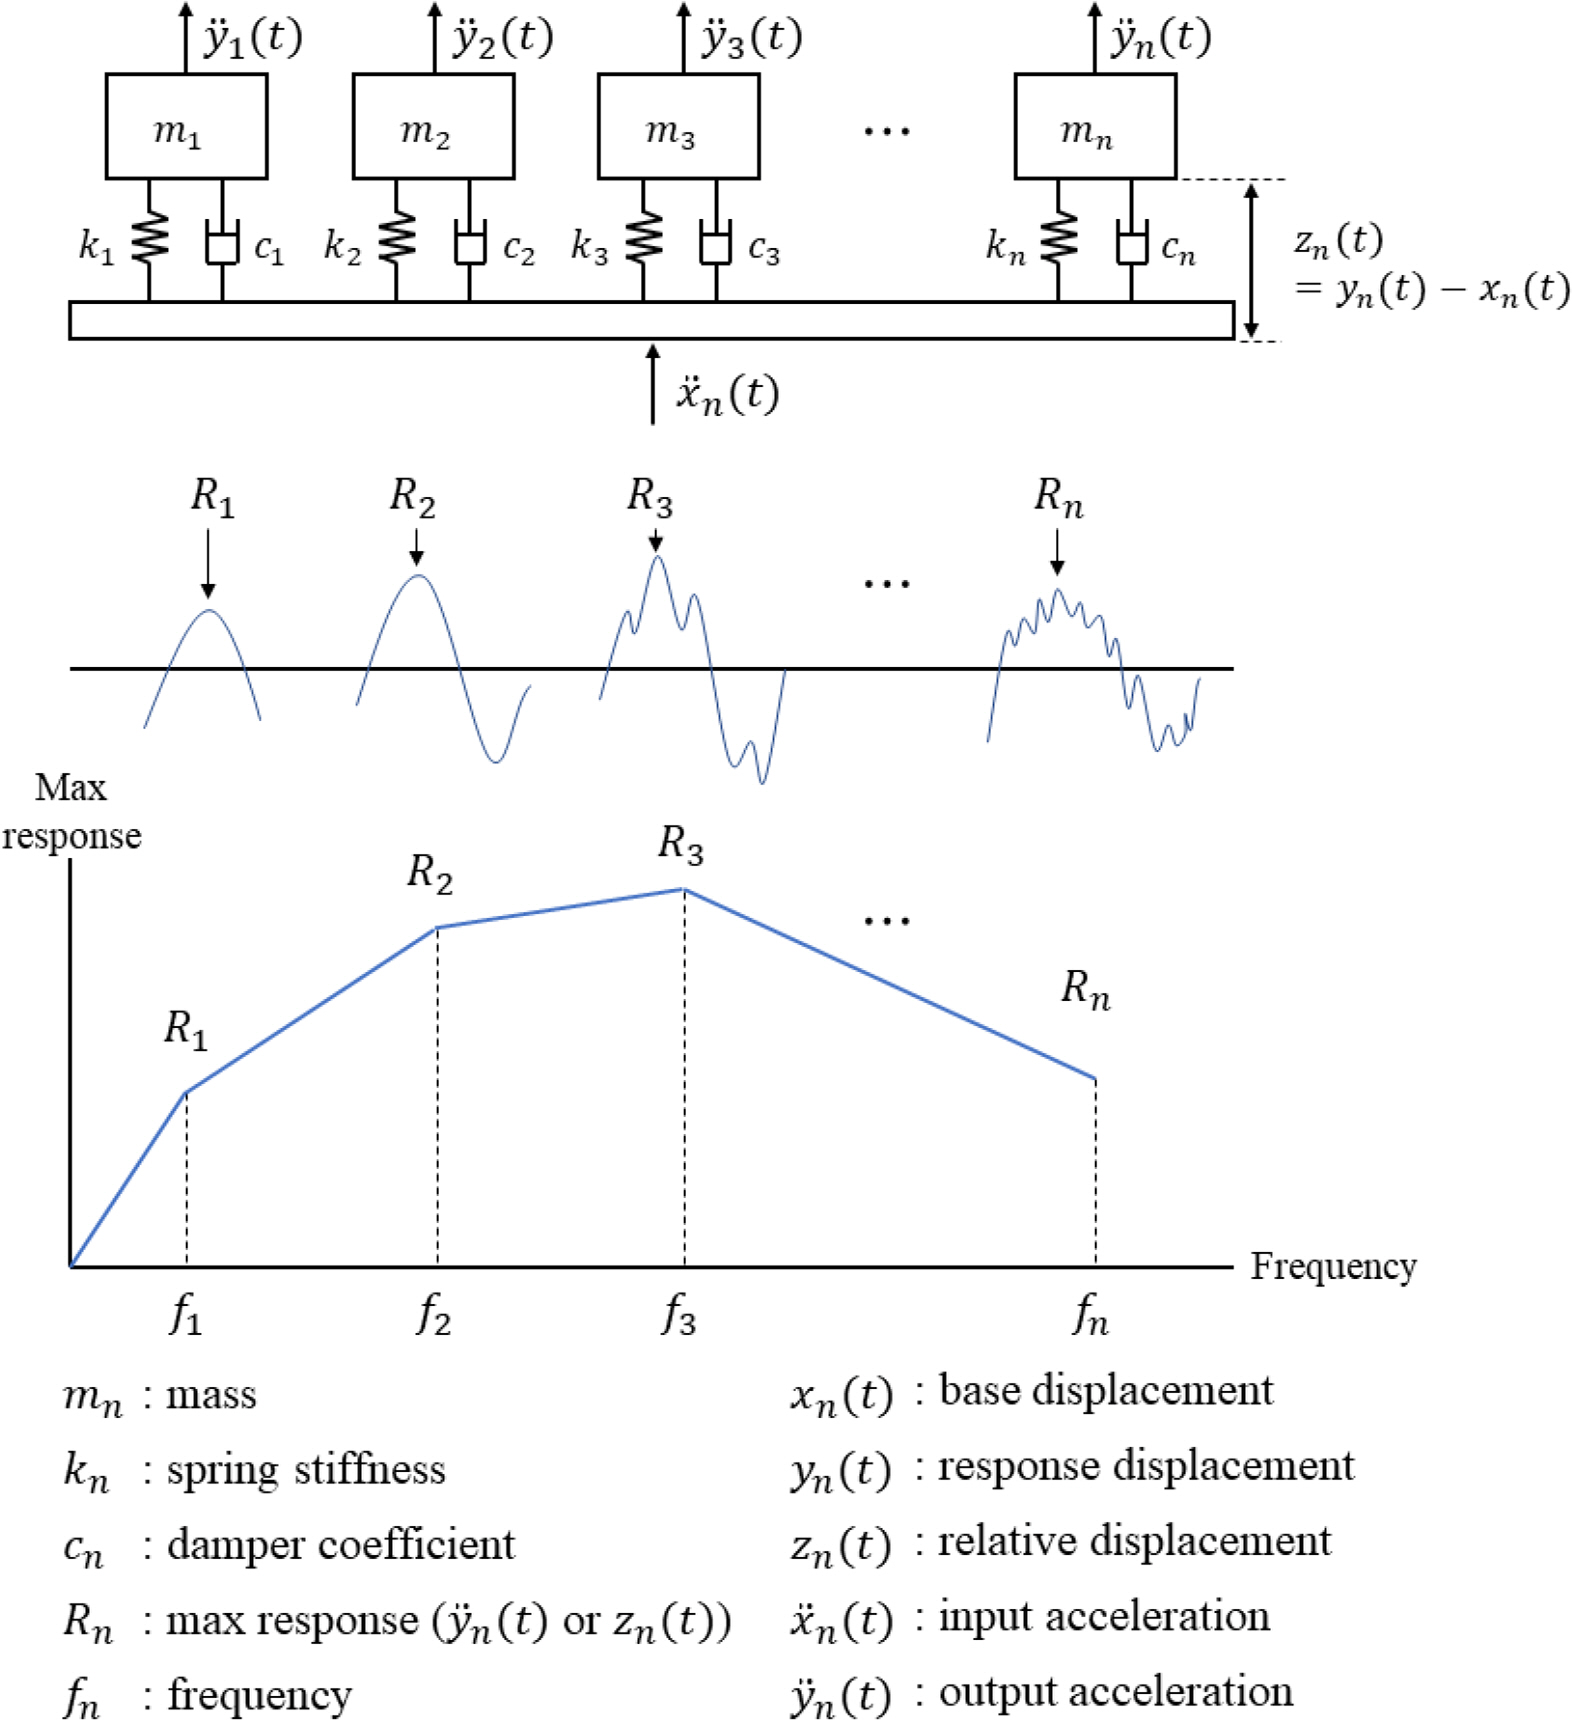
The SRS is given by a response chart to contain the maximum response at each frequency when an arbitrary shock load is applied to a single degree of freedom (SDOF) spring - mass - damper system, as depicted in Fig. 2. The acceleration is the input value for the SDOF system.
According to the type of responses, a SRS is classified into an absolute acceleration type and a relative displacement type. The relative displacement type of Eq. (14) is used mainly for the shock-resistance design of naval ships. fi and Sd in Eq. (14) are the natural frequency and the SRS of the relative displacement, respectively. A PVSS, Spv, can be calculated by multiplying the relative displacement for each frequency by the own frequency. The PVSS unit is the same as the units of velocity.
In this study, the digital recursive filter of Smallwood (1980) was used to calculate the relative displacement SRS. As shown in Eq. (15), the digital recursive filter is a transfer function, where X(z) and Y(z) are z transformations of the input acceleration x┬©(t) and the relative displacement response z(t). The coefficients of b0, b1 and b2 are dependent on the types of response, and they are determined using Eqs. (16), (17), and (18), respectively.
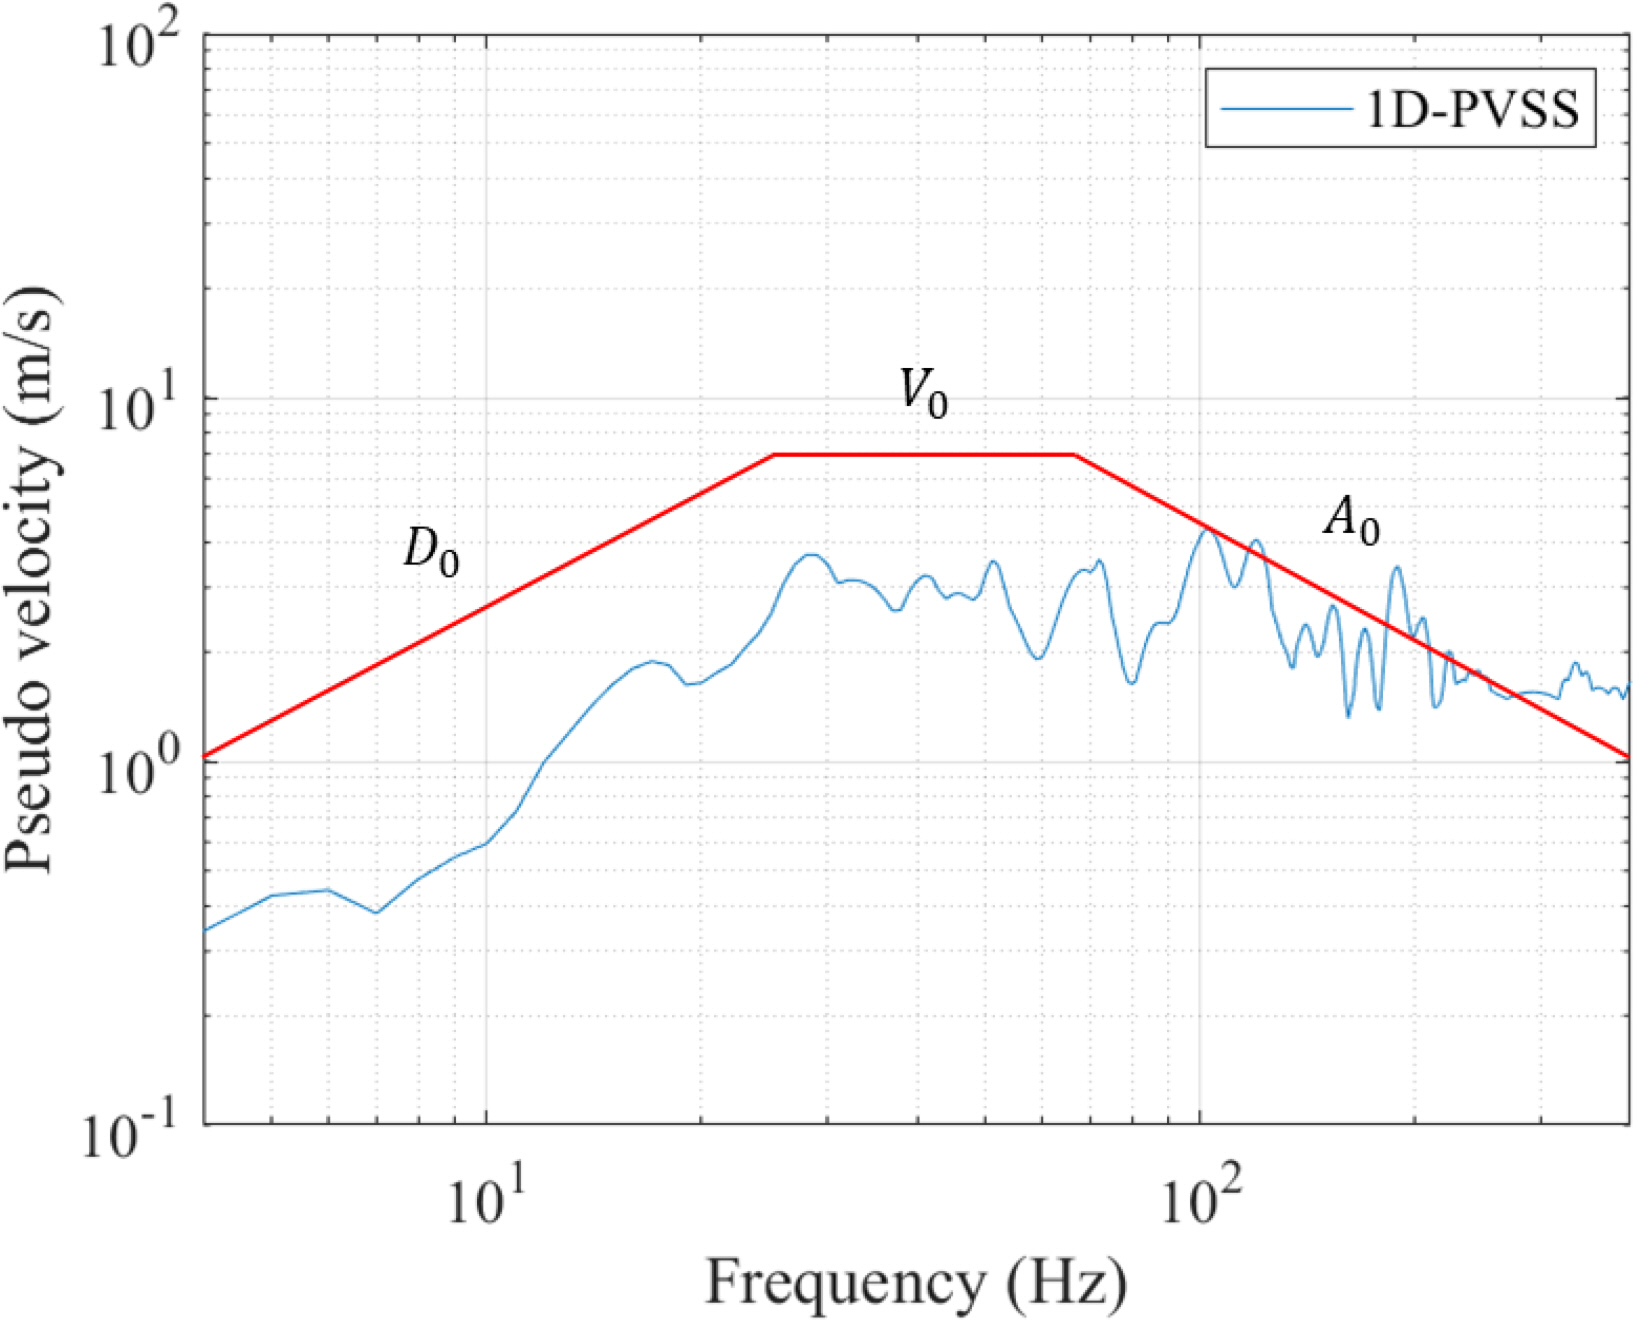
2.3 PVSS Criteria
The BV043 specifies the PVSS criteria shown in Fig. 3, and they are dependent on the ship types (surface ships and submarines), ship displacements (less than 1,000 tons and larger than 2,000 tons), equipment locations (bottom, waterline, and above waterline), and the shock load directions (up/down, port/starboard, and stern/stem). There are three criteria of velocity, i.e. V0, accleration A0, and displacement D0 in the BV043 criteria. Those criteria can be compared directly to the PVSS obtained through the experiments or numerical simulations. The BV043 specifies to use the standard shock accelerations of a half sine wave or a triangular wave, hence a consistent campaign of experiments has been possible.
3. UNDEX Shock Responses
3.1 UNDEX Conditions
A navy ship was chosen for the 1D and 3D shock response analyses with its main specifications summarized in Table 1. As shown in Eq. (19), a keel shock factor (KSF) is decided from the charge weight, wc, stand-off distance, R, and wave incident angle, ╬Ė. In the case that the KSF is given, one of the unknows of charge mass, and incident angle, the stand-off distance can be determined.
The added mass Δa corresponding to the heave motion was determined from Eq. (20) based on a reference (ABS, 2021). Because the added mass is faily dependent on the hull form, more rigorous challeges are necessary to determine the added mass.
NAVSEA (1976) recommended the charge mass and type as a function of the overall length of the ship. The overall length of 130 m produces wc = 544.31 kg of the charge type HBX-1. The wave incident angle of ╬Ė = 90o was assumed to generate the worst UNDEX pressure field. With the charge mass, wave incident angle, and KSF, the stand-off distance of 43.1m was decided. The UNDEX model of Geers and Hunter (2002) was used to generate the primary and gas bubble pressure fields. The charge propeties are summarized in Table 2.
3.2 Analysis Models
3.2.1 1D model
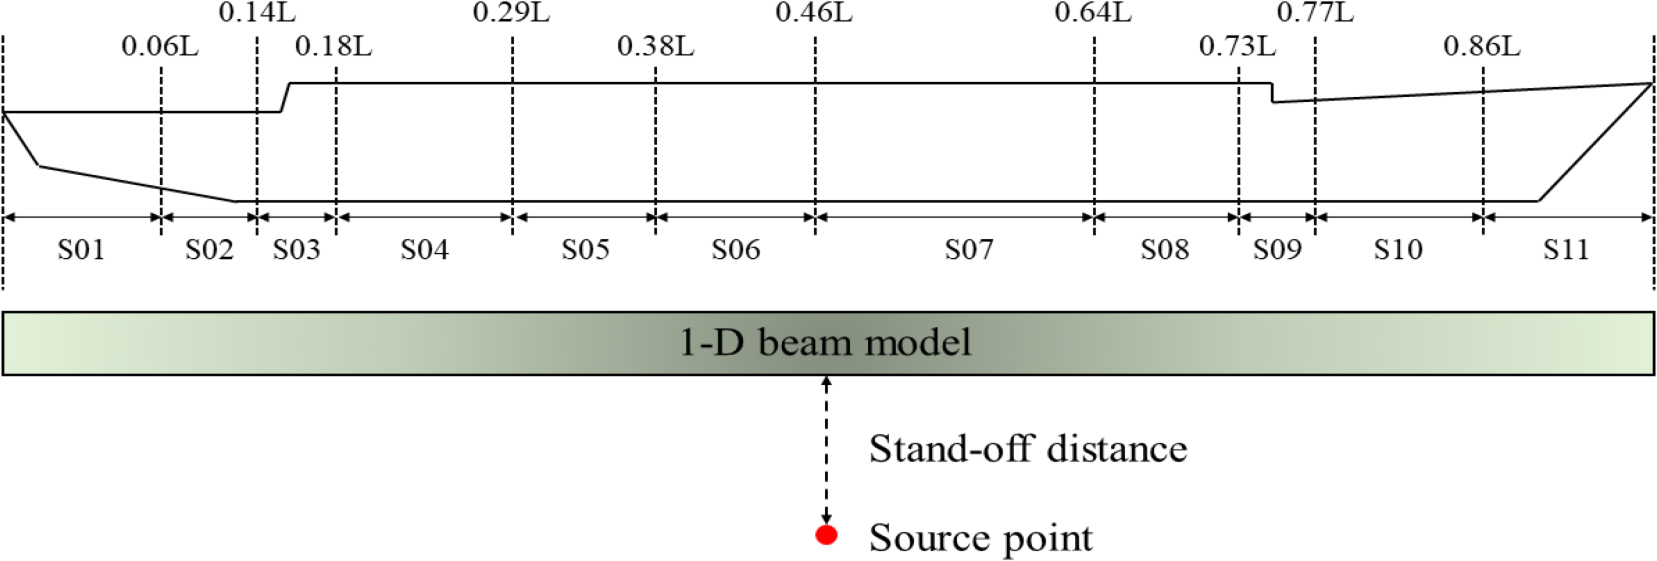
As shown in Fig. 4, the overall ship length was divided into the eleven segments. There was a segment division where there are significant changes in the cross section areas or second moments of cross section areas. As shown in Table 3, it was assumed that each segment has a uniform cross section property along the segment length. The cross sectional area and the second moment of the cross sectional area were normalized by each maxima.
The 1D model for the UNDEX shock response analyses was generated with the Timoshenko beam elements without any fluid domain. The product of the elastic modulus and the cross section area was defined manually as the axial stiffness of the beam elements, while the vertical bending stiffness was the product of the elastic modulus and the second moment of the cross sectional area. The mass density of the steel hull was modified so that the total displacement included the added mass. There were no boundary conditions on the UNDEX model.
The BV043 specifies that a PVSS should be calculated for the frequency range of 3ŌĆō500 Hz. The sampling rate should be over 10 times of the minimum period to avoid any probable distortion of the shock acceleration to use the PVSS input value (Scavuzzo and Pusey, 1996). The sampling rate corresponding to 10 times the maximum period was 2.00E-04 seconds.
The time increment to be used in the shock response analyses should be less than the sampling rate. The time increment of the finite element analysis is determined by Eqs. (21)ŌĆō(22) (Simulia, 2018) where the time increment is controlled by the sound speed in the medium and the element length. Since the density of the analytical model, elastic modulus, and Poisson ratio have been already determined, the time increments smaller than the sampling rate can be obtained by reducing the size of the element.
Table 4 shows the time increment according to the length of the beam element. When the length of the element was less than 1,000 mm, the time increment was smaller than the sampling rate of 2.00E-04 seconds. Therefore, an element length of 1,000 mm was applied to the 1D analysis model.
3.2.2 3D model
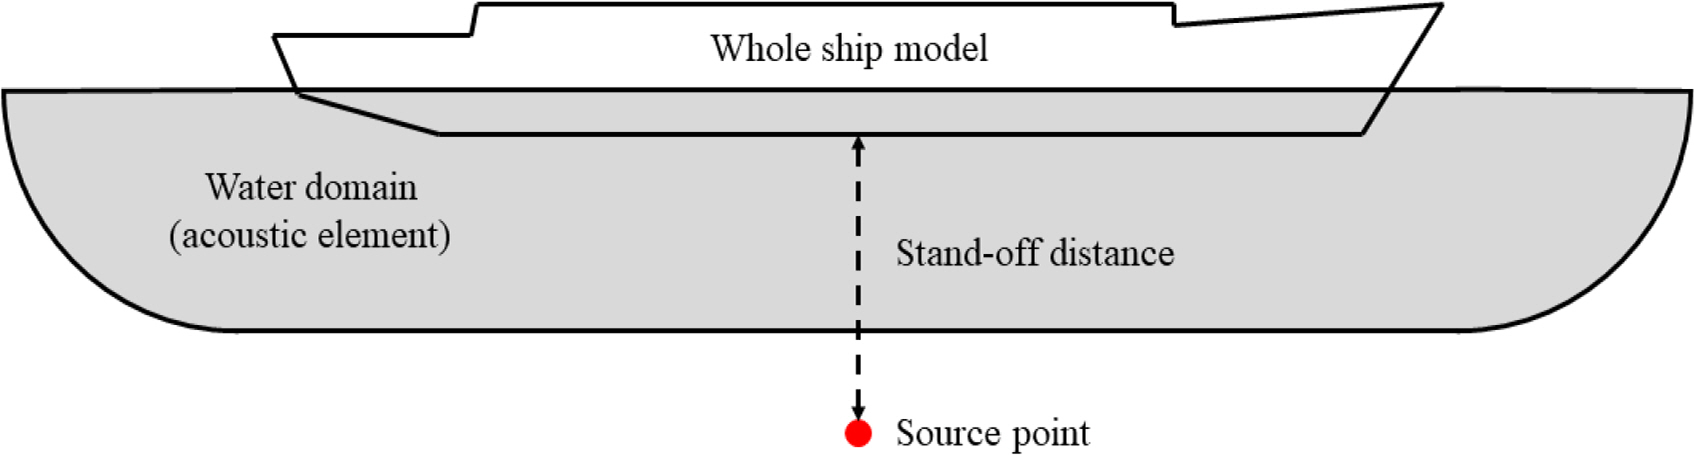
The 3D analysis was not conducted in this study, and the analysis information is just provided. The 3D analysis model is composed of shell elements and beam elements that constitute the hull and acoustic elements, respectively, to transmit the UNDEX loads. (See Fig. 5.) The total displacement was achieved by adjusting the density of the elements because the various weapon systems, engines, and supplies were not included in the 3D model. Mass elements were distributed uniformly over the length of the ship to realize the added mass.
3.3 Shock Response Analysis Results
3.3.1 Comparison between 1D-PVSS and 3D-PVSS
The 1D shock response analysis was performed up to 0.5 seconds. The vertical acceleration history was taken at the position of 0.64L where the propulsion motor was installed. Based on the acceleration, the 1D-PVSS was calculated at 1 Hz intervals in the frequency range of 3ŌĆō500 Hz, and Fig. 6 shows the results. Although the 1D-PVSS and 3D-PVSS show a difference that cannot be neglected, it was confirmed that the overall PVSS patterns were similar. Therefore, the 1D-PVSS was judged to be relatively reliable. The very short computing duration of 426 seconds was necessary for the 1D shock response analysis, while the 3D shock response analysis took several hours. Therefore, a relatively reasonable 1D-PVSS can be estimated in the exploratory development phase of a naval ship.
3.3.2 Comparison between 1D-PVSS and the design criteria
The 1D-PVSS and BV043 design criteria were compared to review the integrity of the shock response design. The conditions in Table 5 were applied to the BV043 to determine the shock response criteria. The PVSS criteria and 1D-PVSS are shown simultaneously in Fig. 7. The 1D-PVSS is within the design criteria in the 3ŌĆō200 Hz frequency range but it exceeds the design criteria after 200 Hz.
Nevertheless, the 1D-PVSS has not been used even for the exploratory development phase because the local stiffnesses of the hull and elastic mounting system were not included in the 1D model. The introduction of some advanced numerical simulation techniques can improve the reliability of the 1D-PVSS. For example, if the global-local interaction technique is used, it is possible to improve the accuracy of the 1D-PVSS sufficiently. After the construction of a local 3D model with detailed mounting structures, the displacements obtained from the 1D model are used to prescribe the boundary conditions of the local 3D model. It is possible to obtain the 3D-PVSS, including the local stiffness effects without modeling of the full ship.
4. Conclusions
In this study, the shock response analysis by the underwater explosion was performed on the 1D model with the charge mass and stand-off distance according to the U.S. NavyŌĆÖs standards and regulations.
Based on the results of the analysis, the 1D-PVSS was derived and compared with the 3D-PVSS. There was a relatively consistent agreement at low frequencies, but a non-negligible difference occurred at high frequencies. This difference was estimated to be because the 3D model included the local stiffness of the equipment mount. Considering that the full ship 1D model requires less cost for modeling than the full ship 3D model and takes less time to analyze the shock responses, the full ship 1D model is predicted to show relatively good efficiency. As a result of comparing the 1D-PVSS and BV043 design criteria, the 1D-PVSS was out of the design criteria in the high frequency range of 200 Hz or higher. If the 1D model is applied in the exploratory development stage where the hull and equipment specifications are still under consideration, an evaluation of relatively quick and reasonabe shock-resistances is possible.
Because 1D models do not include local hull stiffness and elastic mount stiffness, only 3D models have been used even in the exploratory development stage. The 1D model-based PVSS can be improved by the introduction of a new numerical technique.