J. Ocean Eng. Technol. Search

CLOSE


J. Ocean Eng. Technol. > Volume 36(6); 2022 > Article
Van Dang, Shin, Lee, Park, and Park: Numerical Investigation of Countermeasure Effects on Overland Flow Hydrodynamic and Force Mitigation in Coastal Communities

Abstract

Coastal communities have been vulnerable to extreme coastal flooding induced by hurricanes and tsunamis. Many studies solely focused on the overland flow hydrodynamic and loading mechanisms on individual inland structures or buildings. Only a few studies have investigated the effects of flooding mitigation measures to protect the coastal communities represented through a complex series of building arrays. This study numerically examined the performance of flood-mitigation measures from tsunami-like wave-induced overland flows. A computational fluid dynamic model was utilized to investigate the performance of mitigation structures such as submerged breakwaters and seawalls in reducing resultant forces on a series of building arrays. This study considered the effects of incident wave heights and four geometrically structural factors: the freeboard, crest width of submerged breakwaters, and the height and location of seawalls. The results showed that prevention structures reduced inundation flow depths, velocities, and maximum forces in the inland environment. The results also indicated that increasing the seawall height or reducing the freeboard of a submerged breakwater significantly reduces the maximum horizontal forces, especially in the first row of buildings. However, installing a low-lying seawall closer to the building rows amplifies the maximum forces compared to the original seawall at the shoreline.

1. Introduction

The past few decades witnessed rapid population and socioeconomic development in coastal areas. However, low-lying coastal regions have been prone to extreme surges and high waves during hurricanes and tsunami events (Sun et al., 2020). Sweet et al. (2017) reported that the frequency and intensity of hazard events have increased significantly due to climate change, causing low-land areas to face unforeseeable damage. For instance, Hurricane Katrina (2005) resulted in destruction and severe damage to 133,000 houses in only the Mississippi area (Eamon et al., 2007). Hurricane Harvey (2017) severely damaged over 200,000 homes and businesses and induced massive rainfall that displaced over 30,000 people (Aghababaei et al., 2018). Significantly, the 2011 Japan earthquake-induced tsunami (Mw = 9) damaged most countermeasures along the coasts and inundated further inland areas, ultimately causing a massive loss of approximately 15,844 human lives, 128,753 destroyed houses, and 245,376 partially destroyed houses (Aarup et al., 2012). Therefore, investigating mechanisms of overland flow driven by large waves and high surge levels in coastal regions is of great importance for minimizing its impacts and enhancing the resilience of coastal communities.
The hydrodynamic characteristics of coastal communities under inundation flow impacts have caused extensive concern over the last decade. Several previous studies have been conducted to investigate the flow patterns surrounding buildings under overland flow impacts. Park et al. (2013) used a 1:50 scaled physical model to represent an idealized coastal community in Seaside, Oregon. This study experimentally investigated the transformation of free surface elevation, velocity, and momentum flux in the built environment and compared them with the results of numerical modeling. Qin et al. (2018) performed a high-resolution computational fluid dynamics (CFD) model based on OpenFOAM to simulate the tsunami inundation in an idealization of Seaside, Oregon, which was validated using the experimental dataset from Park et al. (2013). The study pointed out the importance of considering the built environment in predicting forces on inland buildings rather than the traditional method by considering drag coefficients (with a recommended value of 2.0). Ishii et al. (2021) performed experimental and numerical investigations on the effects of different building arrangements on tsunami-induced overland flow hydrodynamics and the performance of shielding effects of macro-roughness on the lee side of the buildings. Moreover, Moris et al. (2021) examined the influence of the number of building rows providing shelter on inundation depth, velocity, and loading mitigation in coastal communities. This study indicated that maximum forces significantly decreased by four times when a tsunami propagated in the five most seaward building rows, but a slight decrease was observed from the fifth to the last building row.
Sogut et al. (2019) conducted a laboratory experiment and large-eddy simulation (LES) numerical model to quantify the effects of varied building layouts, including straight, staggered, and single building rows on solitary wave-generated flow hydrodynamics and maximum forces. Staggered layouts amplified maximum forces measured on the front face of buildings in the back row by 30% and 60% compared to only single row and straight layouts. Building rows spaced straightly had the most effective sheltering performance for the force mitigation in the back row (Sogut et al., 2019). Sogut et al. (2021) also investigated the interaction between solitary waves and a series of building arrays by considering the effects of following and opposing steady currents.
Kihara et al. (2021) conducted large-scale experiments with complex topography to represent an idealized coastal industrial site under tsunami-like waves with and without soliton fission. This study indicates that the blocking effects induced by macro-roughness significantly impact maximum inundation depth and suggests a relationship between the pressure and neighboring inundation depths. Generally, the previous experimental and numerical studies focused on understanding flow patterns in coastal communities under extreme overland flows without any mitigation measures. However, several flooding countermeasures are constructed and serve as the first barriers protecting coastal communities on natural coasts, which may influence the mechanisms of overland flow impacts in coastal communities. Therefore, considering the effects of mitigation structures on inundation flow characteristics and loadings on a series of building arrays is essential to provide helpful information for design standards and coastal community resilience planning.
A seawall is one of the most effective mitigation measures constructed worldwide against severe inundation events in residential coastal communities. Field observation was conducted after the Thailand tsunami (2004), and it was reported that houses protected by seawalls experienced minor damage compared to those without protection (Lukkunaprasit and Ruangrassamee, 2008). Oshnack et al. (2009) performed a laboratory experiment to investigate the performance of a seawall at different heights on tsunami bores-induced loadings on the back of a vertical rigid wall. Thomas and Cox (2012) investigated the heights and positions of a finite-length seawall to mitigate tsunami-like wave forces on buildings. The finding shows that increasing seawall heights significantly reduced the runup height, maximum and averaged force with a percent reduction of up to 90% on vertical coastal buildings. Rahman et al. (2014) simultaneously investigated the effects of heights and positions of perforated and solid seawalls on force reduction. The study shows that the maximum force reduction was 41% when installing a higher seawall closer to the building model.
The previous studies reveal that an increase in seawall height is consistent with an increase in the force reduction. However, due to the financial investment or aesthetic issues along shorelines, the seawall height has been typically designed as lower than the overtopping heights generated by unusual events such as storms, hurricanes, and tsunamis (Raby et al., 2015). This limitation makes low-lying areas more vulnerable to extreme coastal flooding events. Thus, additional retrofitting structures may be helpful in maintaining the performance of existing seawalls against extreme overland flows. This study proposes an offshore submerged breakwater as an adaptation solution to lower the seawall height while enabling coastal communities to achieve expected protective levels. The submerged breakwater is a low-cost, environmentally friendly, and aesthetic structure that can effectively dissipate wave energies and alleviate damages from extreme events (Li and Zhang, 2019; Lee and Shin, 2011).
The objective of this study is to investigate the performance of a seawall and a submerged breakwater on hydrodynamics and loadings applied to a series of coastal building rows in coastal communities under overland flow caused by tsunami-like waves through a quantitative CFD model, olaFlow (Higuera et al., 2015). OlaFlow is developed based on an open-source flow solver, OpenFOAM, which was validated by a large-scale experimental dataset. The effect of a seawall and submerged breakwater on the force, velocity, and flow depth attenuation in a built environment was systematically analyzed by considering five prominent factors: incident wave heights, the height and position of seawalls, and the crest width and freeboard of submerged breakwaters.
Section 2 briefly describes the laboratory experiment setup, which was used for numerical validation. Section 3 introduces the OpenFOAM-based olaFlow model setup and presents the performance of a numerical model through verification with the laboratory data. The flow patterns and loading reduction in the building arrays defended by those mitigation measures are discussed in Section 4. Finally, Section 5 presents conclusions and points out limitations for further research.

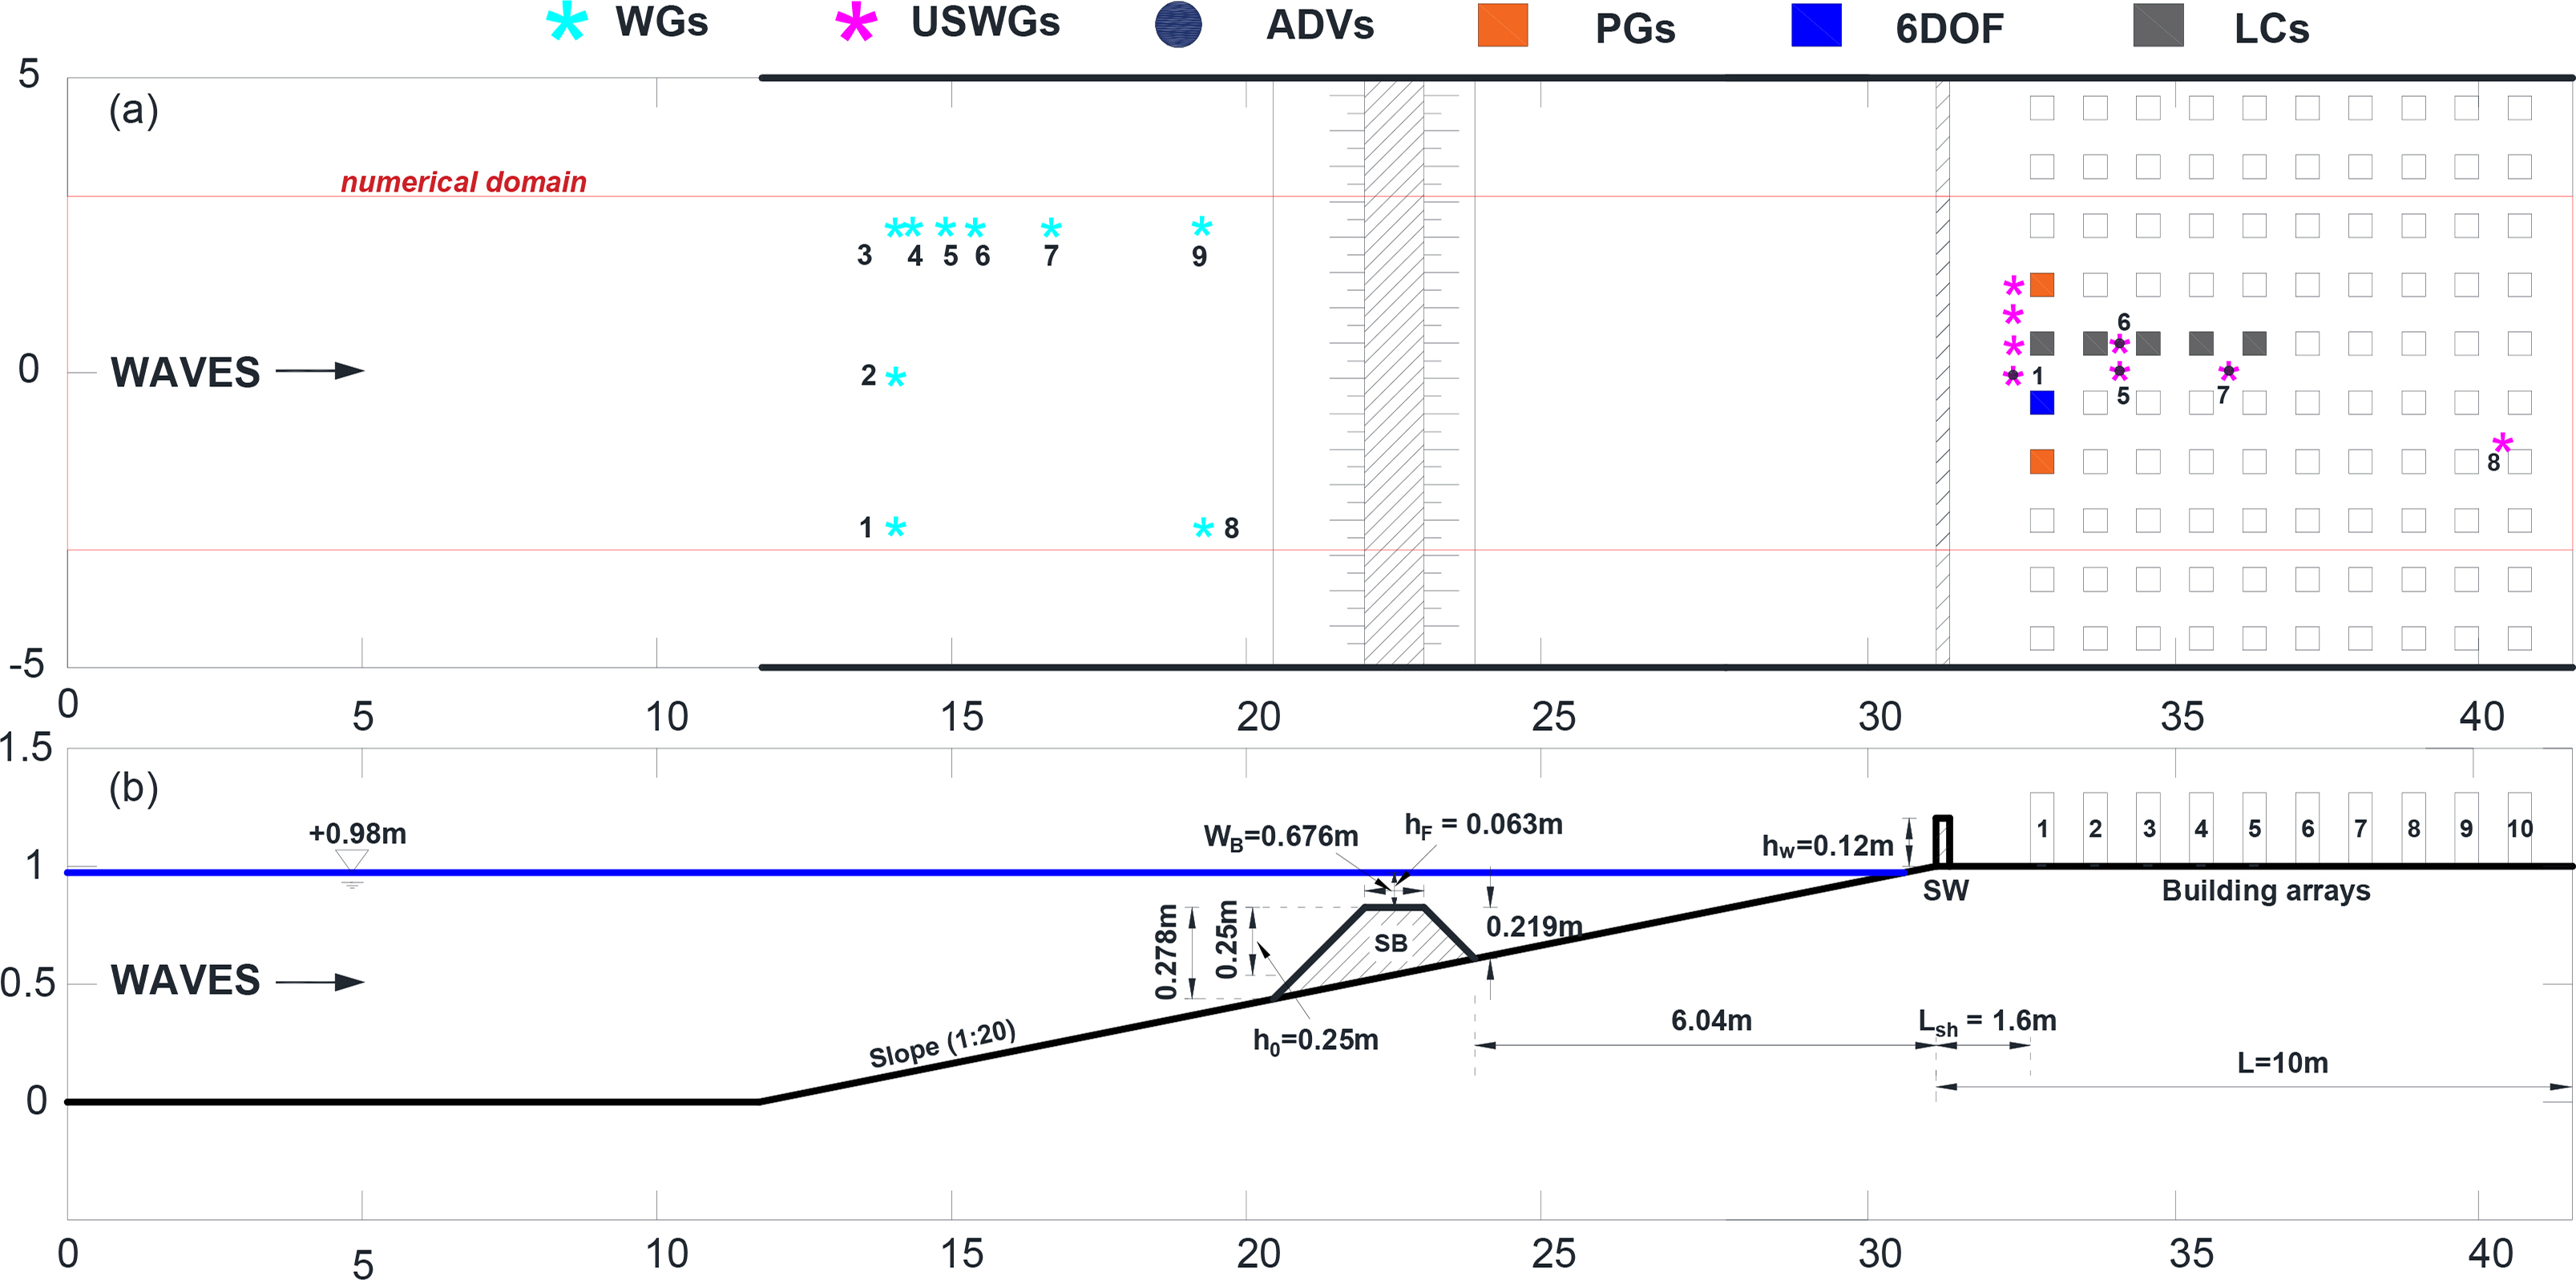
2. Large-Scale Experimental Setup

A large-scale experiment was carried out in a Directional Wave Basin (DWB) at Oregon State University, USA. The wave basin is 48.8 m in height, 26.5 m in width, and 2.1 m in depth and has a piston-type wavemaker with 29 paddles. The hydraulic tests were designed with a 1:20 length scale relative to the prototype scale. The bathymetry profile was composed of an 11.7-m flat concrete bottom followed by a uniform 1:20 sloping section and a 10-m elevated horizontal platform (Fig. 1). A wooden submerged breakwater was spaced in the slope section at x = 24.448 m, and a full-length seawall was located at x = 31.7 m in the elevated horizontal berm at z = +1.0 m. The trapezoidal submerged breakwater has a crest width (WB) of 0.676 m, a 1:1 slope on both sides, and a freeboard (hF) of 0.064 m relative to the specific still water level (d = 0.98 m). The rectangular seawall was designed with a cross-section of 0.12 m × 0.036 m.
100 building units of 0.4 m × 0.4 m × 0.4 m were installed to represent macro-roughness elements, which were organized into 10 × 10 straight building rows. Individual building models were spaced at 1.0 m in the alongshore direction and 0.8 m in the cross-shore direction (center to center). The horizontal distance from the most seaward building row to the beginning of the elevated inland section (Lsh) was 1.6 m, and the full length of the idealized landward coastal area (L) was 10 m. A detailed description of bathymetry is available from Moris et al. (2021) because previous studies also used the same bathymetry.
Fig. 1 shows detailed information on instrumentation used in the experiment. Wave gauges (WGs), ultrasonic wave gauges (USWGs), acoustic Doppler velocimeters (ADVs), pressure gauges (PGs), and horizontal load cells (LCs) were utilized to record incident water surface elevations, inland inundation depths, velocities, pressures, and forces in the built environment, respectively. Moreover, a six-degree-of-freedom loadcell was used in the building model in the most seaward building row to measure both forces and moments in three directions. Nine WGs were used to record the transformation of incident water surface elevations over the sloping beach. WGs 1, 2, and 3 were installed at the same cross-shore distance x = 14.052 m, while WGs 8 and 9 were at x = 19.246 m away from the wavemaker at the zeroed position.
In the elevated flat section, USWGs 1, 5, 6, and 7 and ADVs 1, 5, 6, and 7 were installed in similar positions to measure flow depths and velocities when waves inundated the coastal communities. USWGs 1, 5, and 7 and ADVs 1, 5, and 7 were co-located in center side streets and spaced 0.1 m in the seaward from the first, third, and fifth building rows, respectively. USWG8 was positioned 0.1 m seaward from the tenth building row to examine the inundation depth at the end of the inland section.
The sampling frequency for water surface elevation and velocity data measured by ADVs, WGs, and USWGs was 100 Hz. Twelve PGs, a 6DOF loadcell, and five LCs were used in eight building elements in the built environment (Fig. 1(a)). Six sensors were installed with a spacing of 0.04 m in the centerline of the front face of an aluminum building to measure transient-wave-induced pressures in the first building row. In addition, five horizontal LCs were set up in the five most seaward building arrays to capture the variation of horizontal forces in the built environment (Fig. 1(a)). The 6DOF loadcell, LCs, and PGs recorded data at a sampling frequency of 1000 Hz. Dang et al. (2022) described the physical instrumentation used for numerical verification in this study in more detail.
Conventionally, a solitary wave is used to simulate tsunami-like waves; however, it underestimates overflow loadings on coastal communities due to the limited wavelengths and periods compared to the prototype model (Thomas and Cox, 2012). Therefore, tsunami-like waves were generated using the error function technique, which modifies the solitary wave method by using the time series of the error function in controlling paddle displacement. The history of wavemaker displacement x(t) can be defined as:
(1)
x(t)=1+erf(t/Sf2.871)
in which t is time, and Sf is a scale factor expressed as time used to control how quickly the paddle moves over a full 2-m stroke (Moris et al., 2021). A lower scale factor generates a larger tsunami height. For this study, scale factors were selected as Sf = 2.0 s, 2.5 s, 3.0 s, and 4.0 s corresponding to incident wave amplitudes of 0.21 m, 0.17 m, 0.14 m, and 0.11 m, respectively. The still water level (d) in front of the wavemaker at the initial flat section was 0.98 m. Table 1 shows the wave conditions used in this study. In addition, the experiment was carried out with varying configurations: with a submerged breakwater only (SB), with a seawall only (SW), with a combined seawall and submerged breakwater (SWSB), and baseline conditions (without mitigation alternatives) under four wave conditions.

3. Numerical Model

For a deeper understanding of flow patterns and force mitigations in an idealized coastal area protected by varying structural configurations, this study performed computational simulations based on the olaFlow model, an enhanced version of IHFOAM model (Higuera et al., 2015) that was written in the platform Open-Source Fields Operation and Manipulation (OpenFOAM). OlaFlow uses the finite volume method (FVM) for spatial discretization and solves Reynolds averaged Navier-Stokes (RANS) equations for incompressible flows by using a PIMPLE algorithm (a mixture of the pressure implicit with splitting of operators (PISO) and semi-implicit method for pressure linked equations (SIMPLE)) (Park et al., 2017). The volume of fluid (VOF) approach was used to track the free surface displacement from water-air phases (Ishii et al., 2021). To model the turbulence, the k solver was selected for the current simulation because this turbulence closure solver is more effective than other turbulent closure solvers (e.g., k-ϵ model) in modeling partially separated flows when the overland flow propagates and then is separated by building rows in the constructed environment (Qin et al., 2018). In addition, olaFlow provides several options for wave generation and absorption, enabling the numerical model to replicate wave characteristics in a physical laboratory (Moris et al., 2021). A detailed explanation of the olaFlow solver is on the olaFlow website (https://olaflow.github.io/).

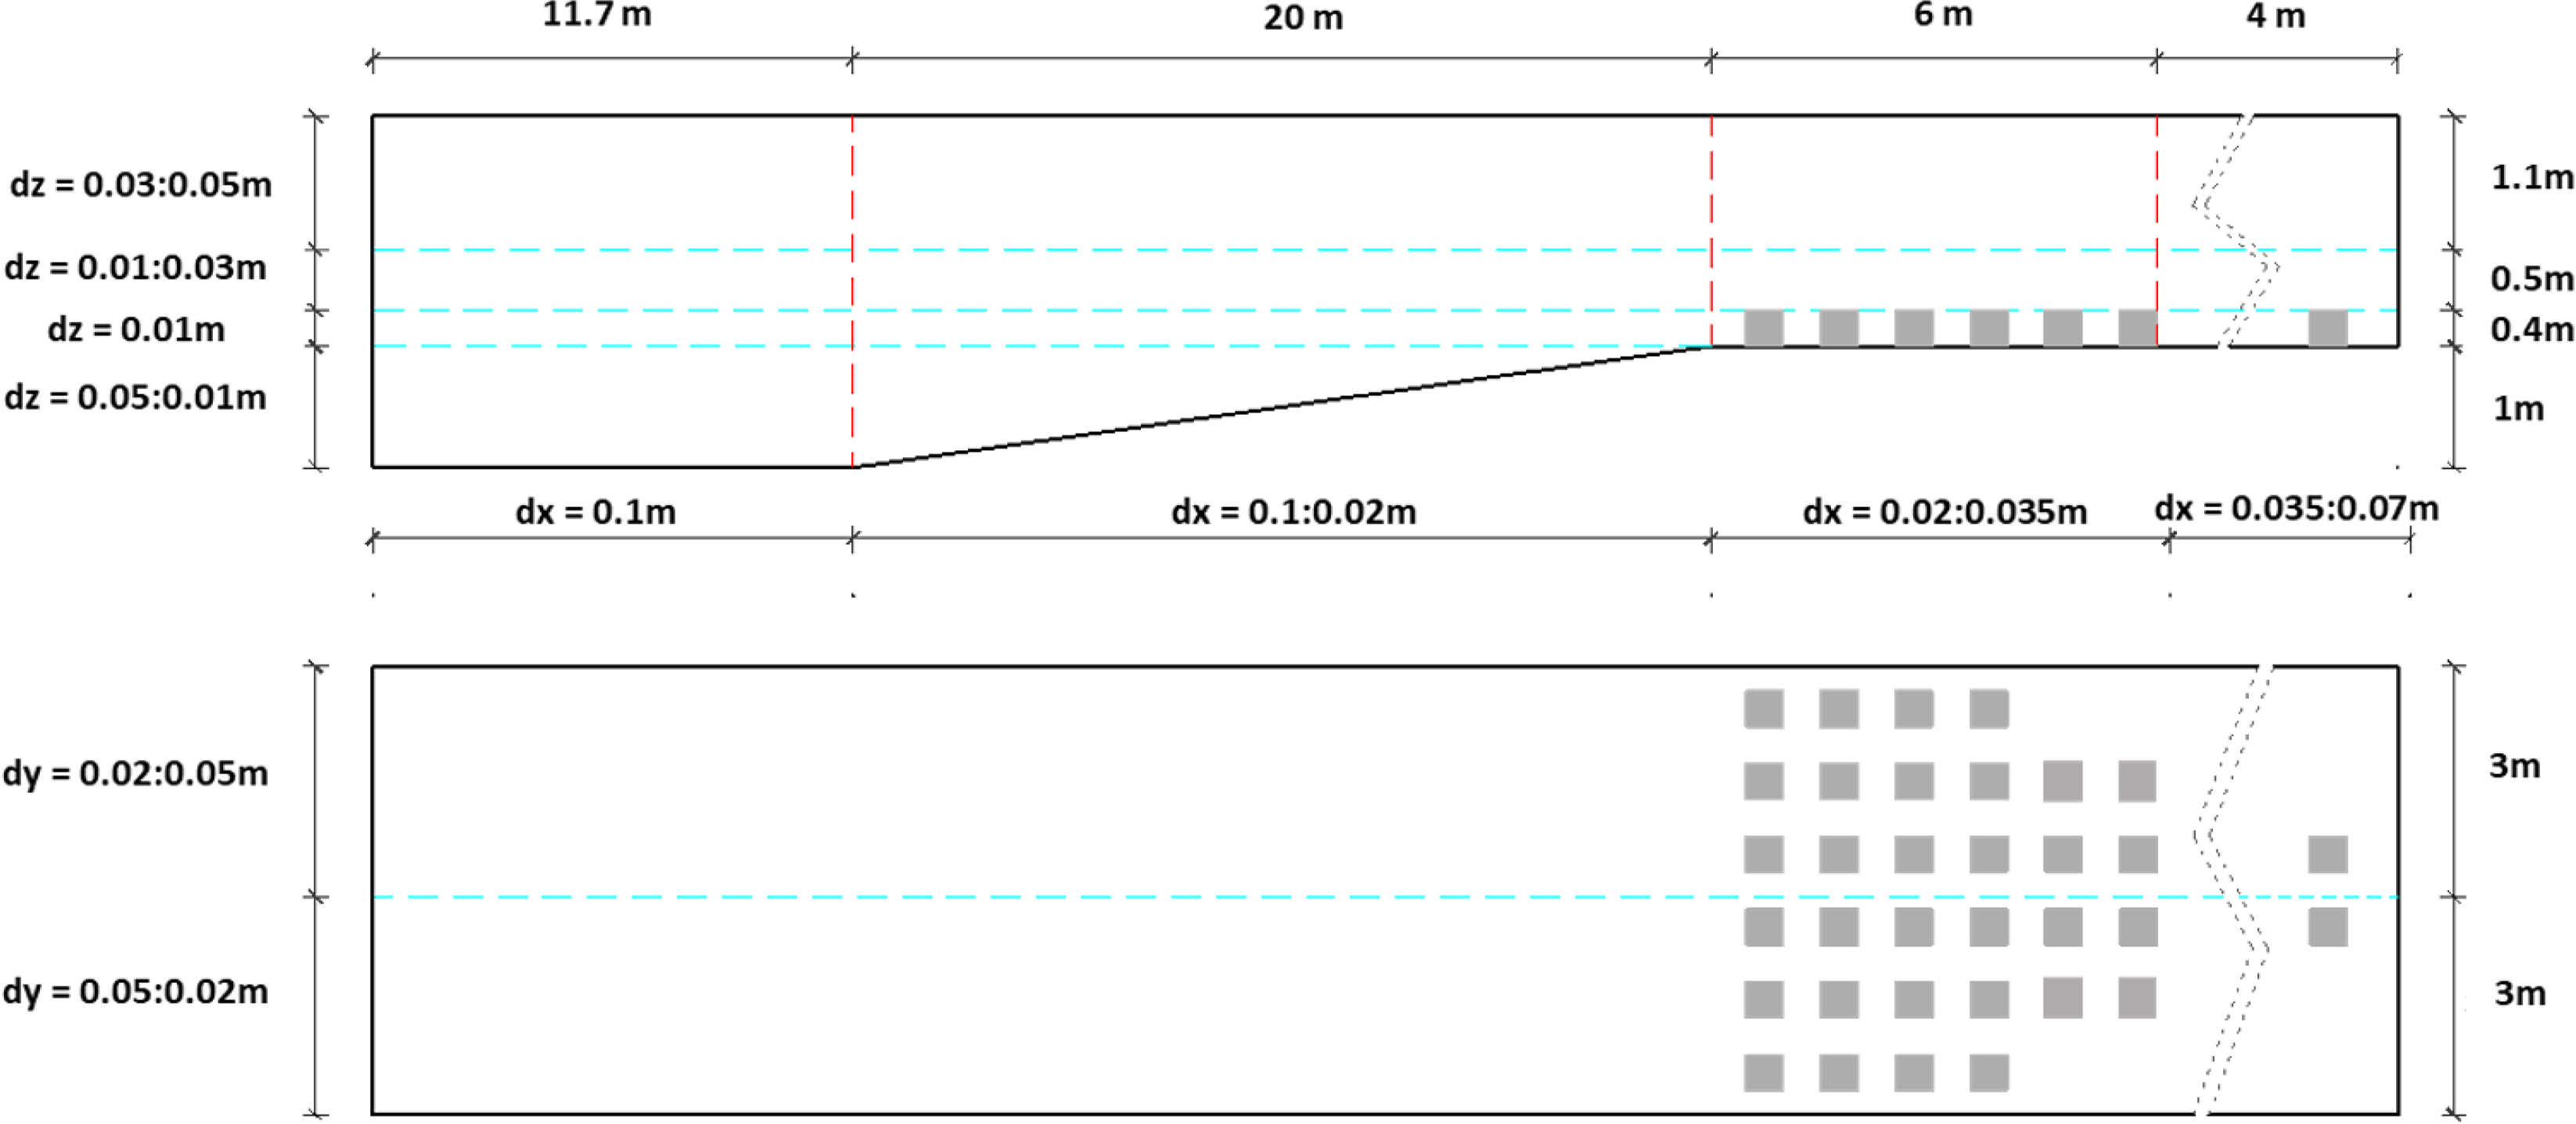
3.1 Numerical Model Setup

To save computational resources and guarantee agreement between physical and numerical results, the boundary of the numerical tank was reduced slightly from 10 m to 6 m in the y-direction, which was enclosed by the solid red line in Fig.1(a). However, the numerical tank in the x- and z-directions remained unchanged. In the numerical model, 10 building rows were also installed in the elevated flat section, but the number of buildings per building row was decreased from 6 buildings in the first four rows to 2 buildings in the most landward rows (Fig. 2). The boundary conditions of the numerical model were set up as follows. We assigned the bottom profiles and structures as wall functions with no-slip boundary conditions and considered slip boundary conditions for lateral walls of the 6-m-wide numerical domain. The top boundary was modeled as the atmosphere. The tsunami-like wave-induced overland flow was modeled using the piston-type wavemaker boundary (inlet) provided in olaFlow. The measured time series of water surface elevations (measured from wave gauges at the experimental wavemaker) and velocities (calculated based on wavemaker displacement data) were utilized for wave input in the numerical inlet to replicate the incident tsunami-like waves.
To achieve convergence of the spatial discretization, coarse (G1), medium (G2), and fine grid (G3) mesh conditions were utilized for model validation. Each mesh size is variable depending on the location of the wave basin. The finer mesh size was set up near the onset of an elevated landward area and building arrays. Fig. 2 illustrates the side and top views of the numerical model indicating the detailed information on the fine mesh (G3), in which dx, dy, and dz are the grid sizes in the x, y, and z directions, respectively. In the G3 condition, the mesh size was 0.1 m × 0.05 m × 0.05 m (length × width × height) at the flat section near the wavemaker. This size was gradually refined to the smallest mesh size of 0.02 m × 0.02 m × 0.01 m in the region near the start of the elevated flat section, in which strong nonlinear wave deformation induced by wave breaking was observed. Regarding the G1 and G2 conditions, the smallest mesh sizes were 0.04 m and 0.08 m in all directions near the onset of the landward section and reached a maximum of 0.2 m near the wavemaker.
It is noteworthy that all mesh sizes described above were structured sizes (blockMesh tool) of the box-type boundary. However, meshes for the 1:20 sloping section and elevated landward area section were also created by an unstructured mesh generator (snappyHexMesh tool), making mesh cell sizes near the structures smaller than the corresponding cells in blockMesh. The unstructured mesh tool further divided cells in the regions with an intersection between structures and boundary domains (such as buildings, seawalls, and submerged breakwaters).
The cells of intersect region were divided by half, meaning that each blockMesh cell became eight smaller cells. The total number of grid cells in G3 was approximately 9.5 million, which increased by 3 and 10 times from the G1 and G2 conditions. An individual case was computed with a tower server with 24-core parallel processors and required average times of 2 hours, 8 hours, and 16 hours for G1, G2 and G3 and all configurations, respectively. The fine mesh condition was the finest mesh used in the convergent test. When the grid size was further refined, the results were not sufficiently improved when we consider the much larger computational expense and time requirements compared to the availability of computational resources.

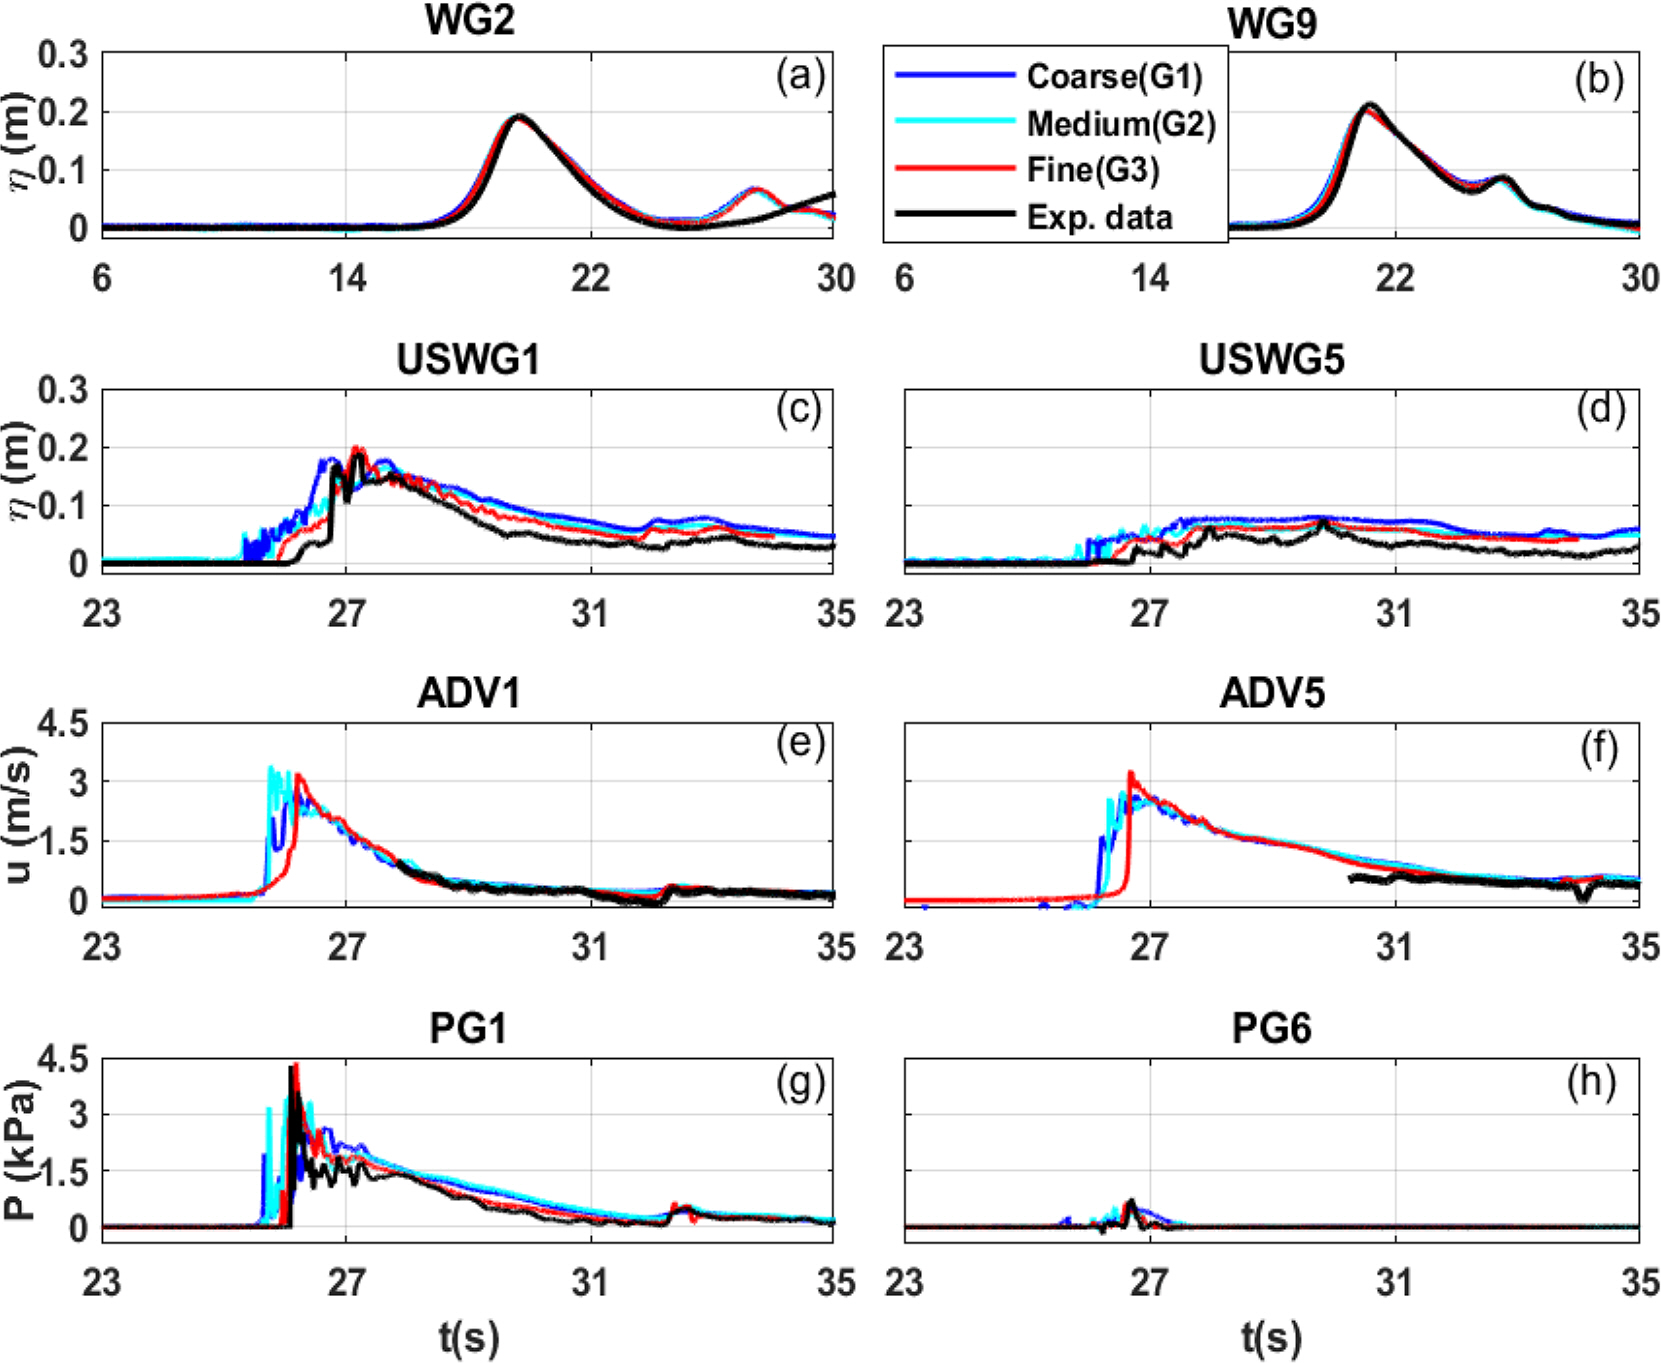
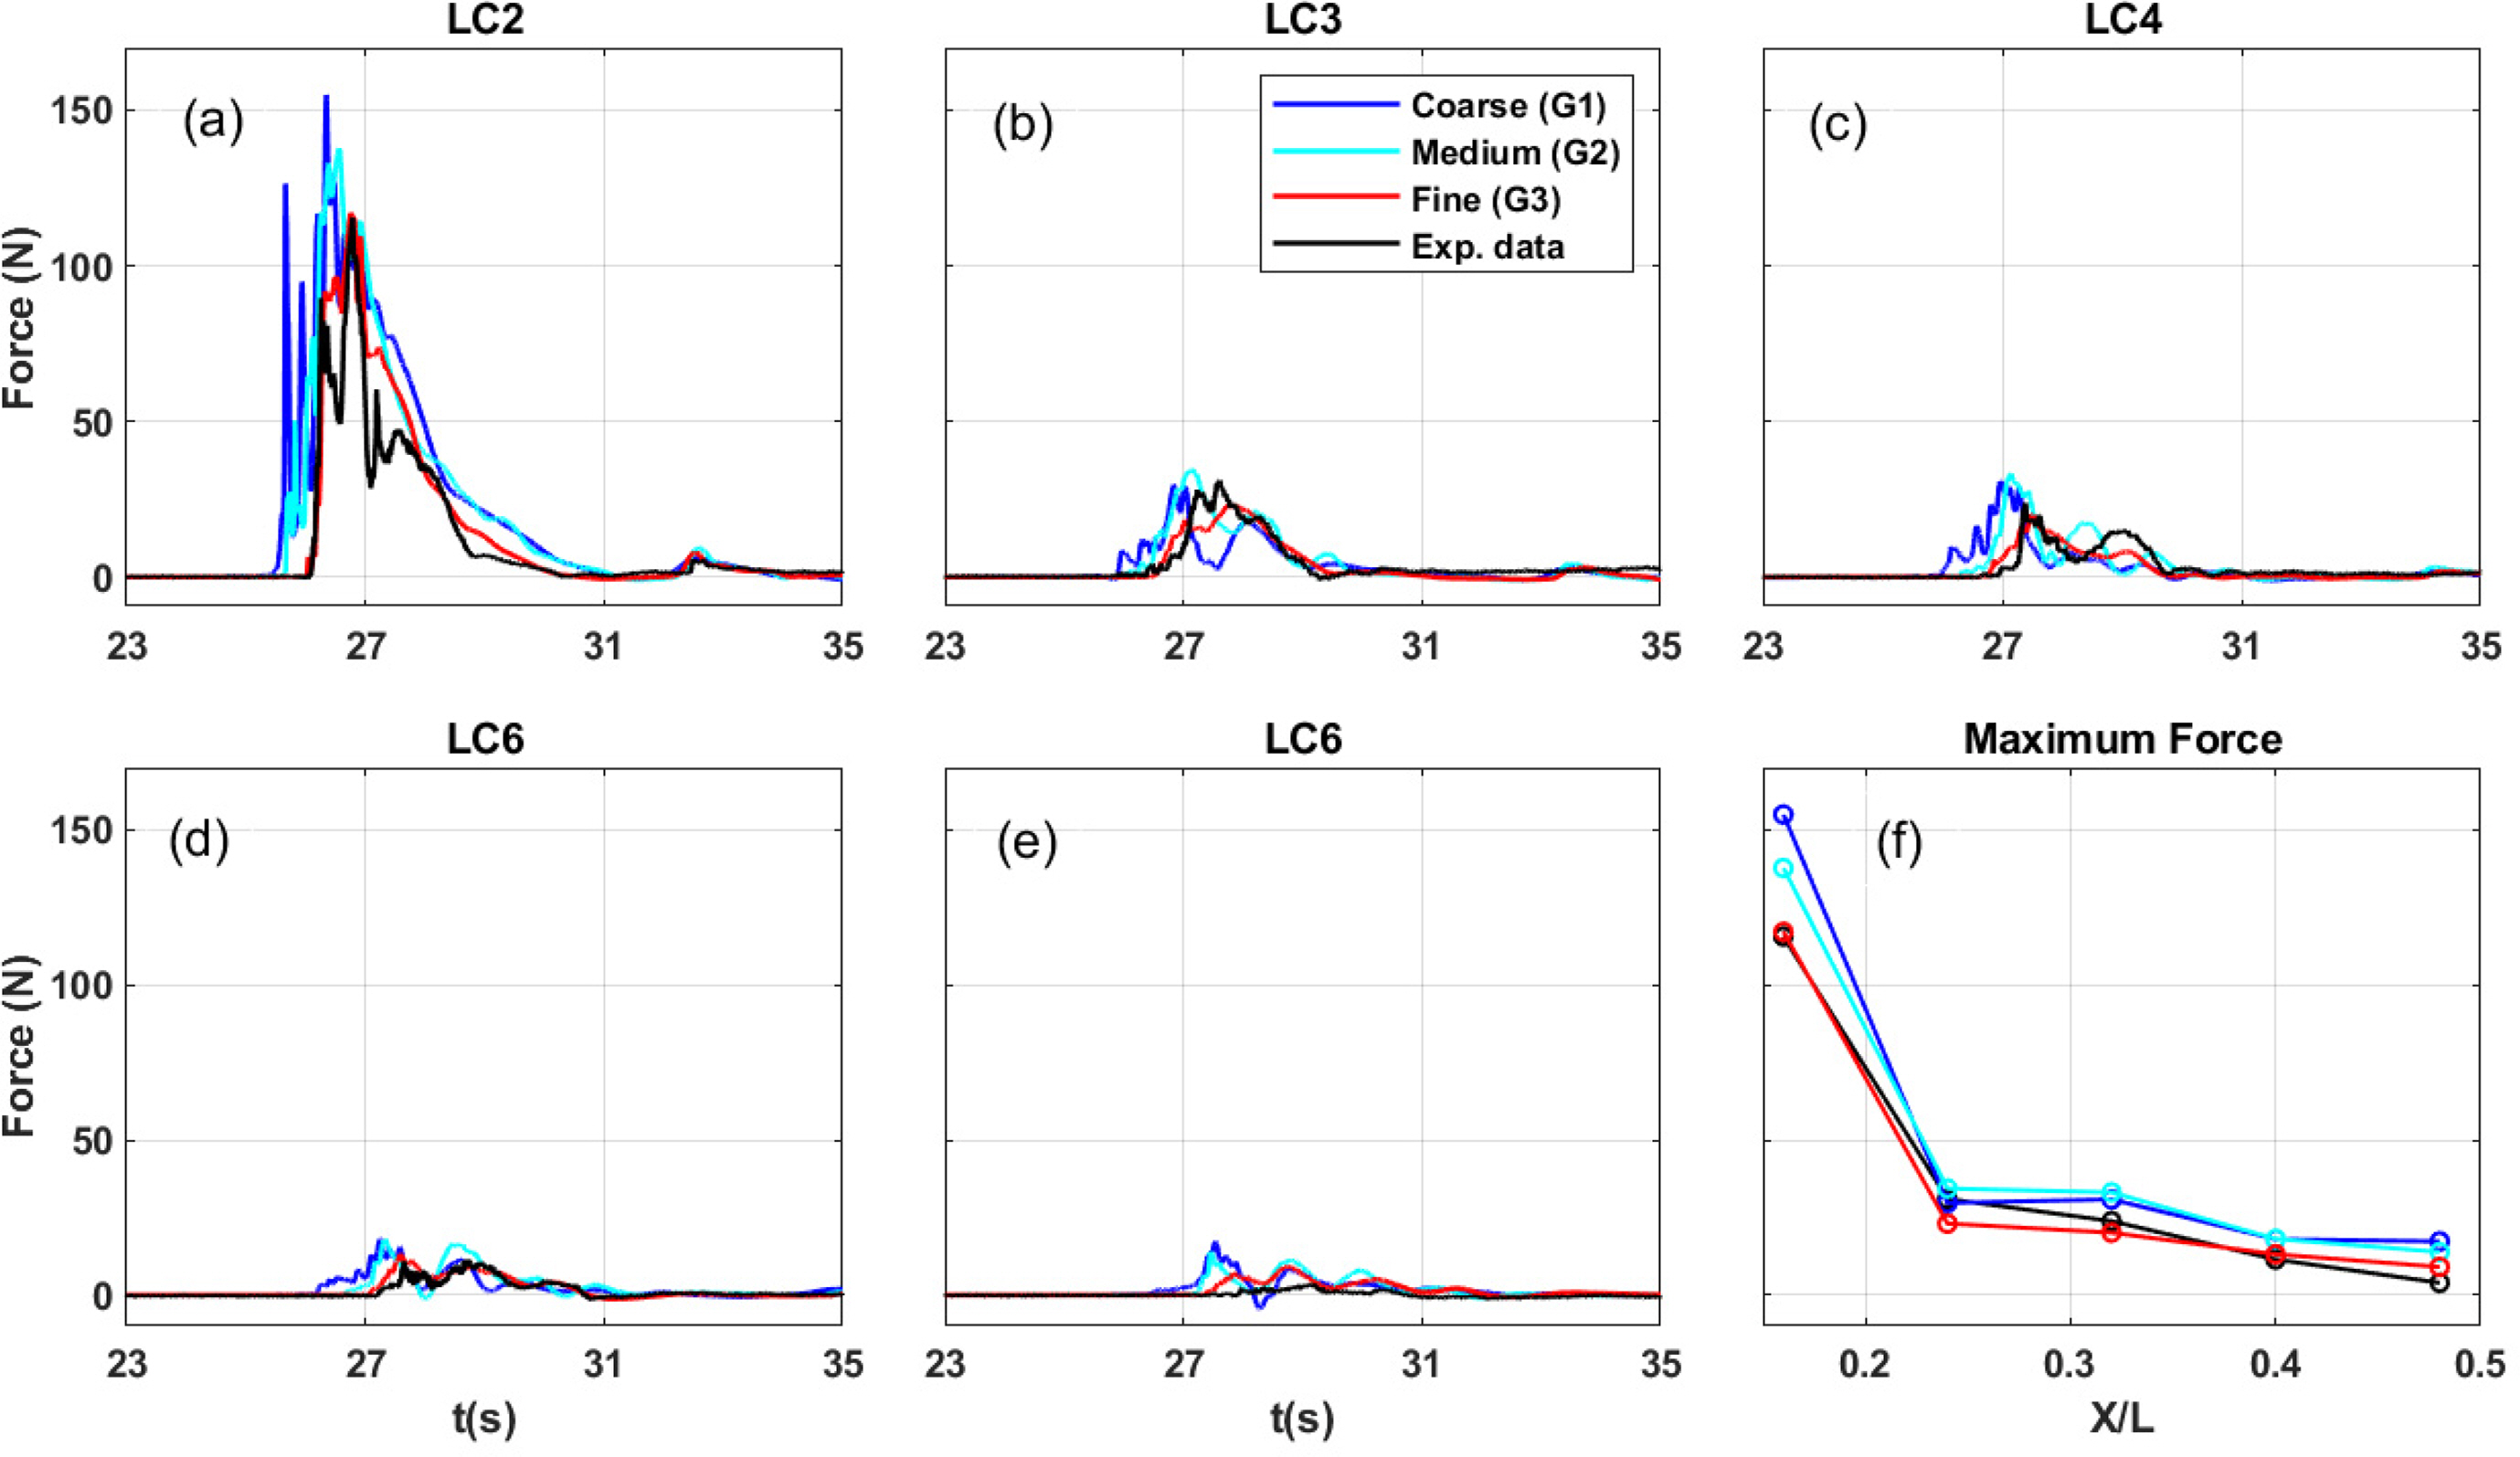
3.2 Numerical Model Validation

The numerical model was validated with the physical experimental results. Overall, the results of the olaFlow model showed good agreement with the measured experimental results despite some minor inconsistencies in velocity and pressure. Fig. 3 shows the comparison between simulated and measured onshore and offshore free surface elevations, cross-shore velocities, and pressures in the combined structural configurations (SWSB) for wave case 1. Figs. 3 (a) and (b) present the time series of offshore water surface elevations at two wave gauges (WG2 and WG9). Simulated elevations for the three mesh size conditions are similar to measured elevations in both durations and peak magnitudes. However, the reflected waves overlapped a part of the incident waves measured at WG9 at t = 25.5 s (Fig. 3(b)).
Figs. 3 (c) and (d) shows a comparison of the time series of measured and simulated flow depths located 0.1 m seaward from the first and third building rows. Although the three mesh-size conditions have slightly different peak flow depths and wider crest widths than measured elevations, the correlation between numerical and experimental results is generally reasonable. While the G1 condition generated a 10% larger peak flow depth compared to the measured one, both G2 and G3 conditions showed approximately a 5% difference for both USWG1 and USWG5.
Good agreement was observed for the cross-shore velocity from numerical data and available data measured by ADV1 and ADV5 in the physical experiment (Figs. 3 (e) and (f)). The missing experimental data is the leading edge of velocities that cannot be captured by ADV1 and ADV5 because the instruments were exposed to air first before the arrival of flows that were too shallow, causing poor data. Figs. 3 (g) and (h) indicate the time series of pressures measured by PG1 and PG6, in which the lowest pressure sensor PG1 was located 0.02 m above the flat bottom, and PG6 was at the highest elevation among the pressure sensors at z = +1.26 m. For PG1, only a 1.3 % difference in maximum pressure was recorded, while the measured and simulated maximum pressures at PG6 were similar in the fine mesh condition (G3).
The current numerical model reproduced the time series of cross-shore wave-induced forces measured on the first five building rows well (Figs. 4 (a)–(e)). The fine mesh condition agreed with the experimental data well except for somewhat complex wave motions. The measured and simulated peak forces had differences of up to 24% and 15% for the G1 and G2 conditions, respectively, but G3 generated only 0.3% larger peak horizontal forces than the measured ones in the first building row (Fig. 4(a)).
Maximum forces measured in the five most seaward building rows as a function of the relative distance X/L are shown in Fig. 4(f). X is the distance of each loadcell from the shoreline, and L is the total length of the idealized coastal constructed environment (L = 10 m). For five building rows, the largest difference between measured and simulated maximum forces was observed in row 2 at less than 20% in the three mesh size conditions, but surprisingly, from row 3 to row 5, an improvement in the agreement between recorded and simulated maximum pressures can be observed with less than 15% difference in the G3 condition. In general, this numerical model effectively replicates the time series of flow depth, velocity, force, and pressure measured in the laboratory experiment.

4. Results and Discussion

In this section, a numerical investigation of the mechanism of overland flow propagation in the built environment over different wave conditions is conducted, in which the dimensions and locations of a seawall and submerged breakwater are kept unchanged from those conducted in the laboratory experiment. However, a series of other numerical simulations based on the physical experiment was also carried out to study the effects of geometrical factors and spacing of countermeasures on the performance of flooding mitigation structures in reducing hydrodynamic loads in the built environment. To analyze varying geometrical factors, the tsunami-like wave condition with the largest incident wave amplitude (A) of 0.21 m and water level (d) of 0.98 m was utilized.

4.1 Hydrodynamic Characteristics and Loadings in the Constructed Environment

The complex flow patterns surrounding the building rows in the constructed environment with the installation of only a seawall, only a submerged breakwater, a combined seawall and submerged breakwater, and no protection from the mitigation structures (baseline condition) were simulated and are illustrated in Fig. 5. Dimensions of flooding mitigation structures are the same as those used in the laboratory. The largest intensity of wave conditions with a water level of 0.98 m and an incident wave amplitude of 0.21 m (relative height: A/d = 0.213) was selected to investigate the overland flow hydrodynamic characteristics. The time instants were chosen to allow us to compare each configuration’s effects on the interaction of overland flows and a series of building arrays. After impinging on the front faces of building rows, overland flows were separated by individual building blocks, inducing jet-type channelized flows with shallower elevations and stronger velocities through the gaps between macro-roughness elements. For over configurations, diffracted waves from two sides of individual blocks directly impacted the sharp edges and merged into the center of each block in the back building rows, which generated runup on the front face of the back buildings. Soon after runup waves reached their maximum height, descending runup in buildings in the back row caused an offshore-directed wave, which was trapped by front and back rows until full dissipation of the wave energy.
Figs. 5 (a) and (b) indicated that flow patterns were symmetric for the baseline and SB configurations, but the SB configuration slightly delayed the arrival time and had more velocity of the inundation flow than the baseline condition. The maximum velocity recorded in the baseline condition was approximately 4 m/s, compared to 2.7 m/s in the SB configuration. Symmetric vortices were formed at the sharp edges of each individual building block in the two configurations.
Fig. 5(c) illustrates that the seawall induced asymmetric flow patterns due to its large energy dissipation. Water splashes with high velocities were created at the different time instants of t = 25.7 s and 25.9 s, but the magnitudes of velocities were significantly reduced when passing the side streets. With the protection of the combined seawall and submerged breakwater countermeasures (SWSB), the tsunami-like wave impacts on the coastal areas were significantly delayed and generated overland flows with lower intensity compared to other configurations. The combined structures dramatically reduced the quantity of overtopped and reflected waves in the front faces of building elements (Fig. 5(d)). Waves impinged the first building row at 25.9 s with relatively large wave splashes in the front of the first building row, but the flow was similar to those in the baseline and SB configurations.
Fig. 6 shows the comparisons of time histories of hydrodynamic forces on the first three building rows in the three structural configurations and the baseline condition. As shown in this figure, the maximum forces measured in structural configurations were significantly lower than the baseline force. The SB and SW configurations induced a relatively similar maximum force in the first building row, which accounted for approximately 75% of the maximum force (25% reduction) in the baseline configuration. In contrast, the maximum baseline force in the first building array was reduced by 38% with both a seawall and submerged breakwater. For the second and third rows, there was an insignificant difference in peak forces for all configurations, but SWSB induced the lowest maximum hydrodynamic forces, which were reduced by about 48% and 38% relative to the baseline forces, respectively.

4.2 Effects of Incident Wave Heights

This section examines the effects of different incident wave amplitudes on the performance of mitigation structures in reducing maximum flow depths and horizontal forces on the first building rows. Four wave conditions with relative wave ratios were selected: A/d = 0.213, 0.174, 0.143, and 0.112. The water level (d) was set at 0.98 m, and the dimensions of mitigation structures were kept unchanged from the experimental sizes described in section 2. Fig. 7 shows the variation of maximum flow depths and horizontal forces in the most seaward building rows for different wave conditions. Generally, the mitigation structures reduced the maximum flow depths and horizontal forces in the four wave conditions. In Fig. 7(a), a significant increase in the flow depth is seen during 0.112 < A/d < 0.174, while there is little change at A/d > 0.174 for structural configurations. As shown in Fig. 7(a), the seawall configuration is better than the submerged breakwater at reducing the flow depth. The SB configuration slightly reduced the maximum flow depths by 5% to 22%, and a significant reduction from 25% to 40% was seen in the SW configuration compared to the baseline condition. The multi-tiered configuration (SWSB) is more effective than these individual configurations at reducing flow depth by a maximum of 64% in the four wave height conditions.
Similar to the flow depth, a linear increase in maximum force recorded at the first building row, as shown in Fig. 7(b). Although the flow depth measured in the SB configuration is higher than in the SW condition, there is an insignificant difference in maximum forces in the two configurations. This happens because the velocity measured in the SW configuration is larger than in the SB configuration (Figs. 5 (b) and (c)). The SB-only and SW-only configurations decreased the horizontal baseline forces from 25% to 58%, respectively. SWSB conditions resulted in larger force reductions by 38% to 84% relative to the baseline at different wave heights.

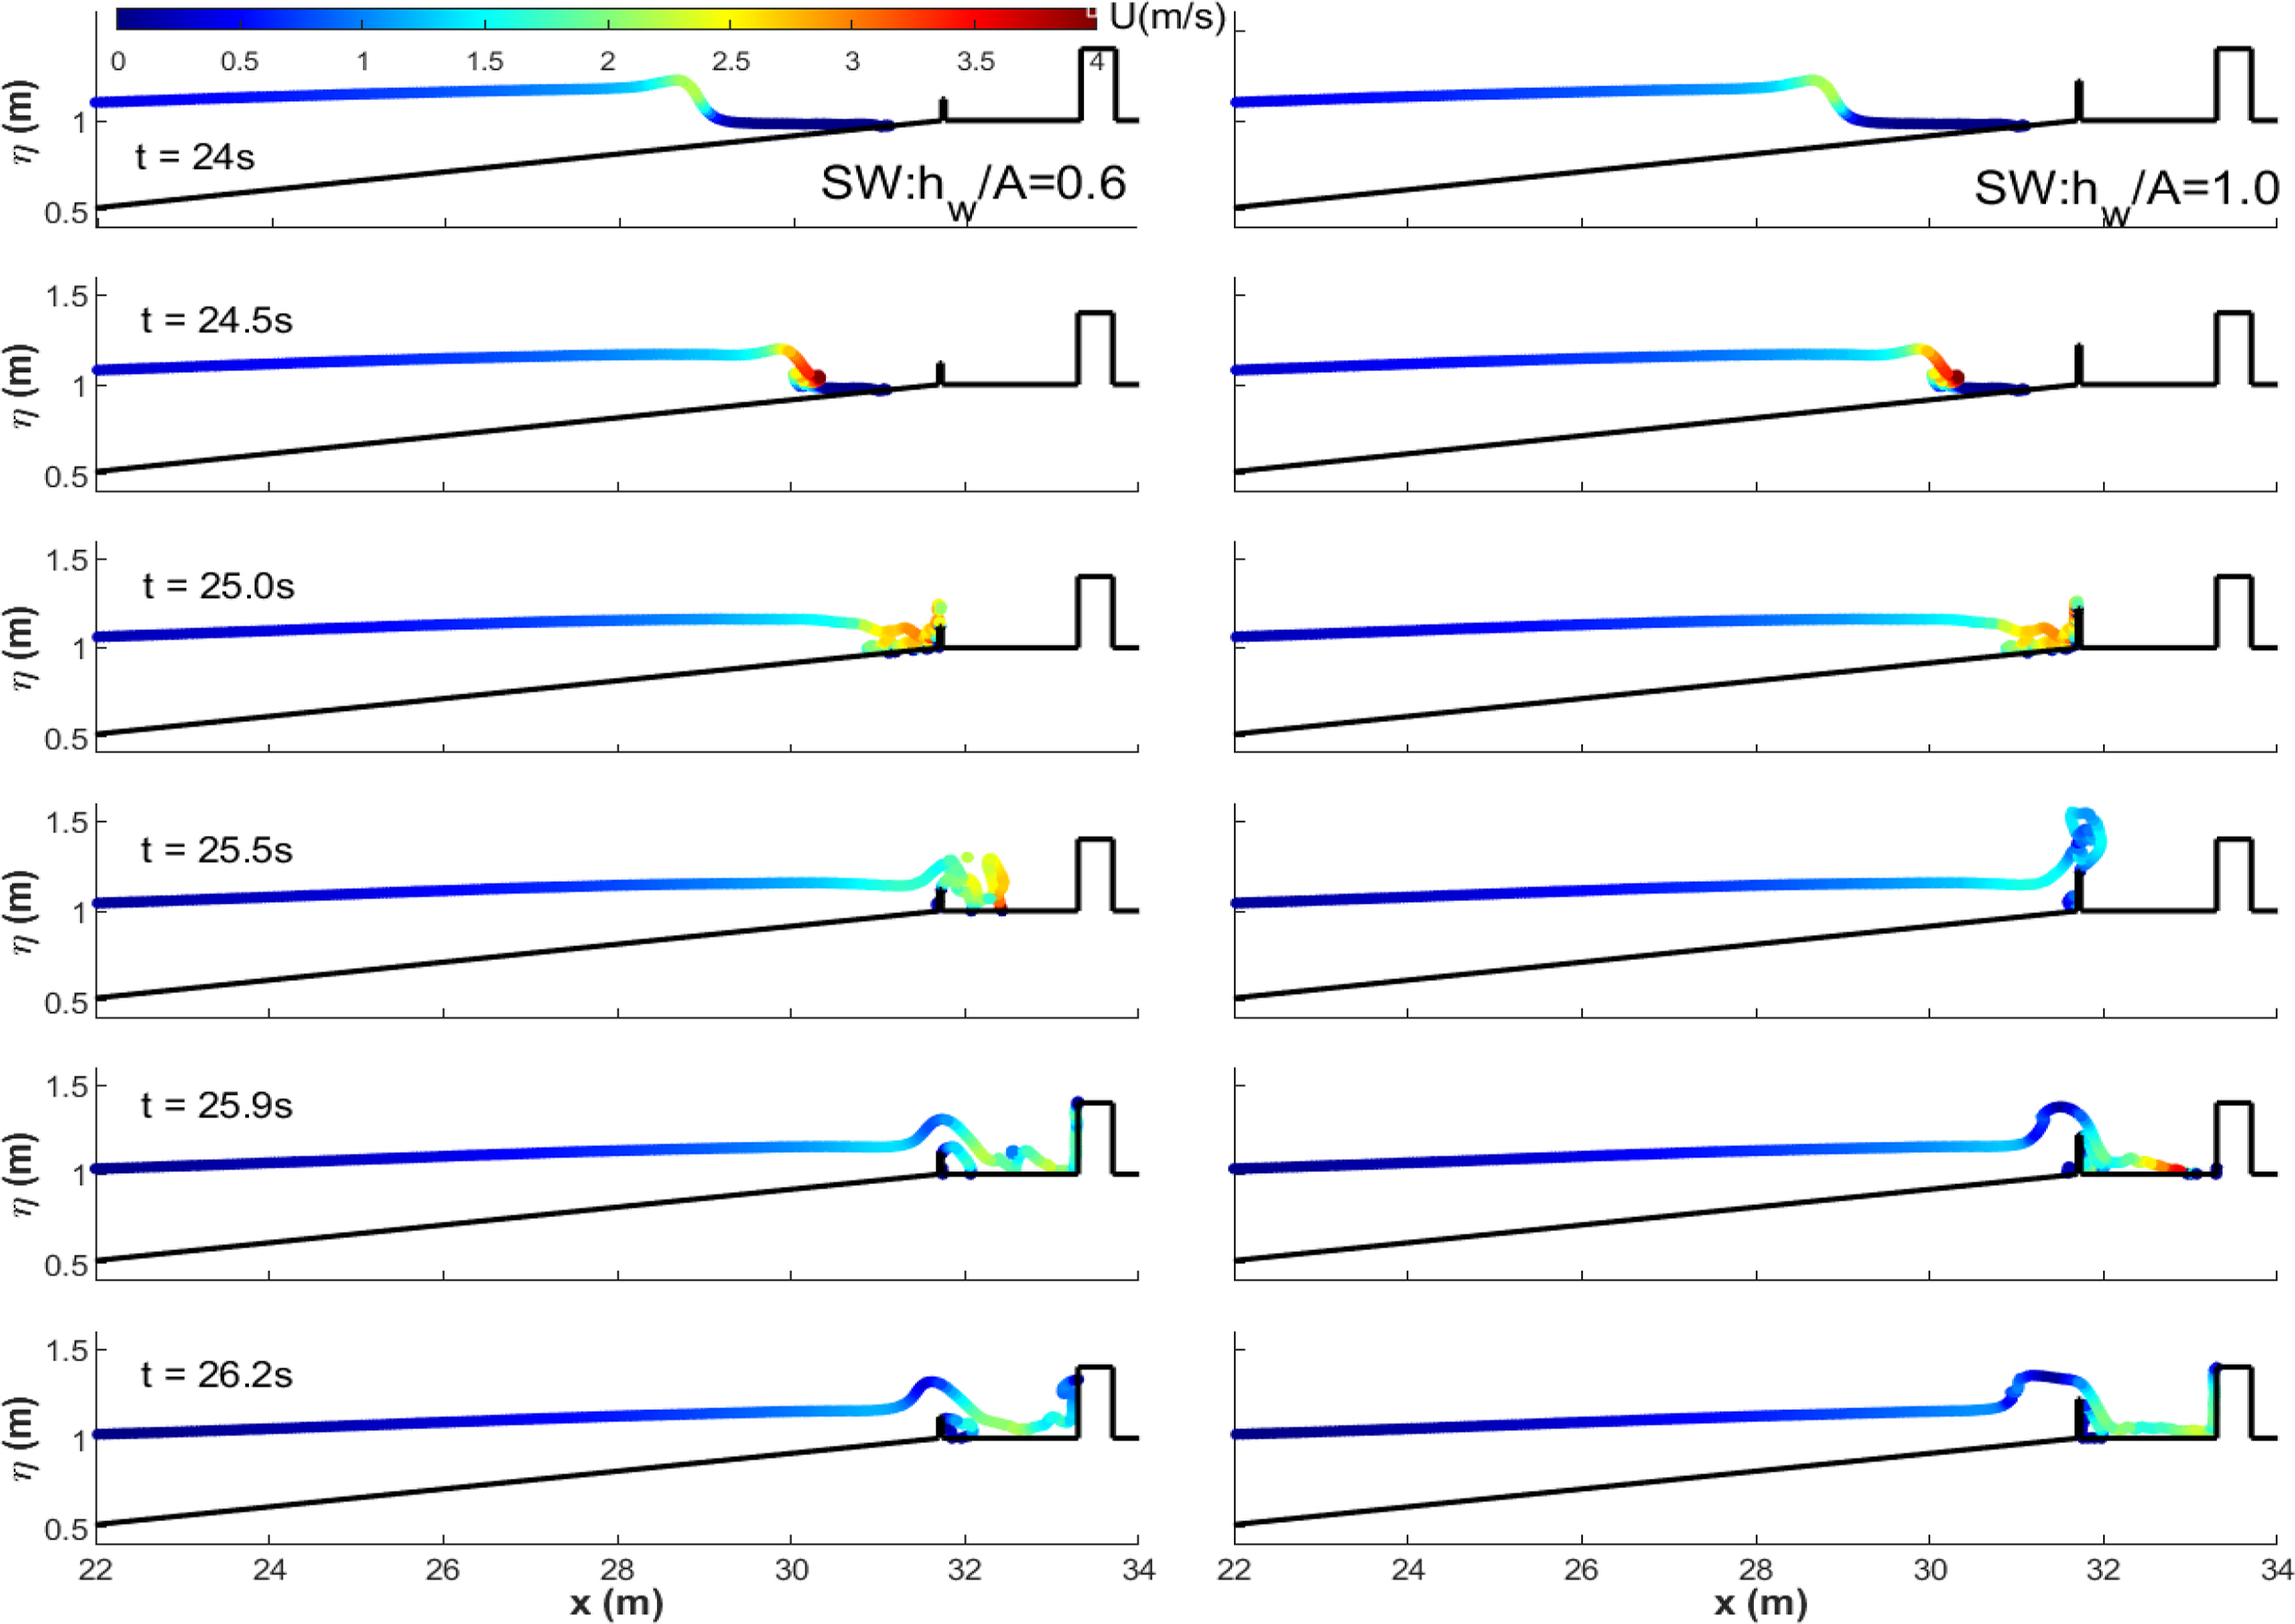
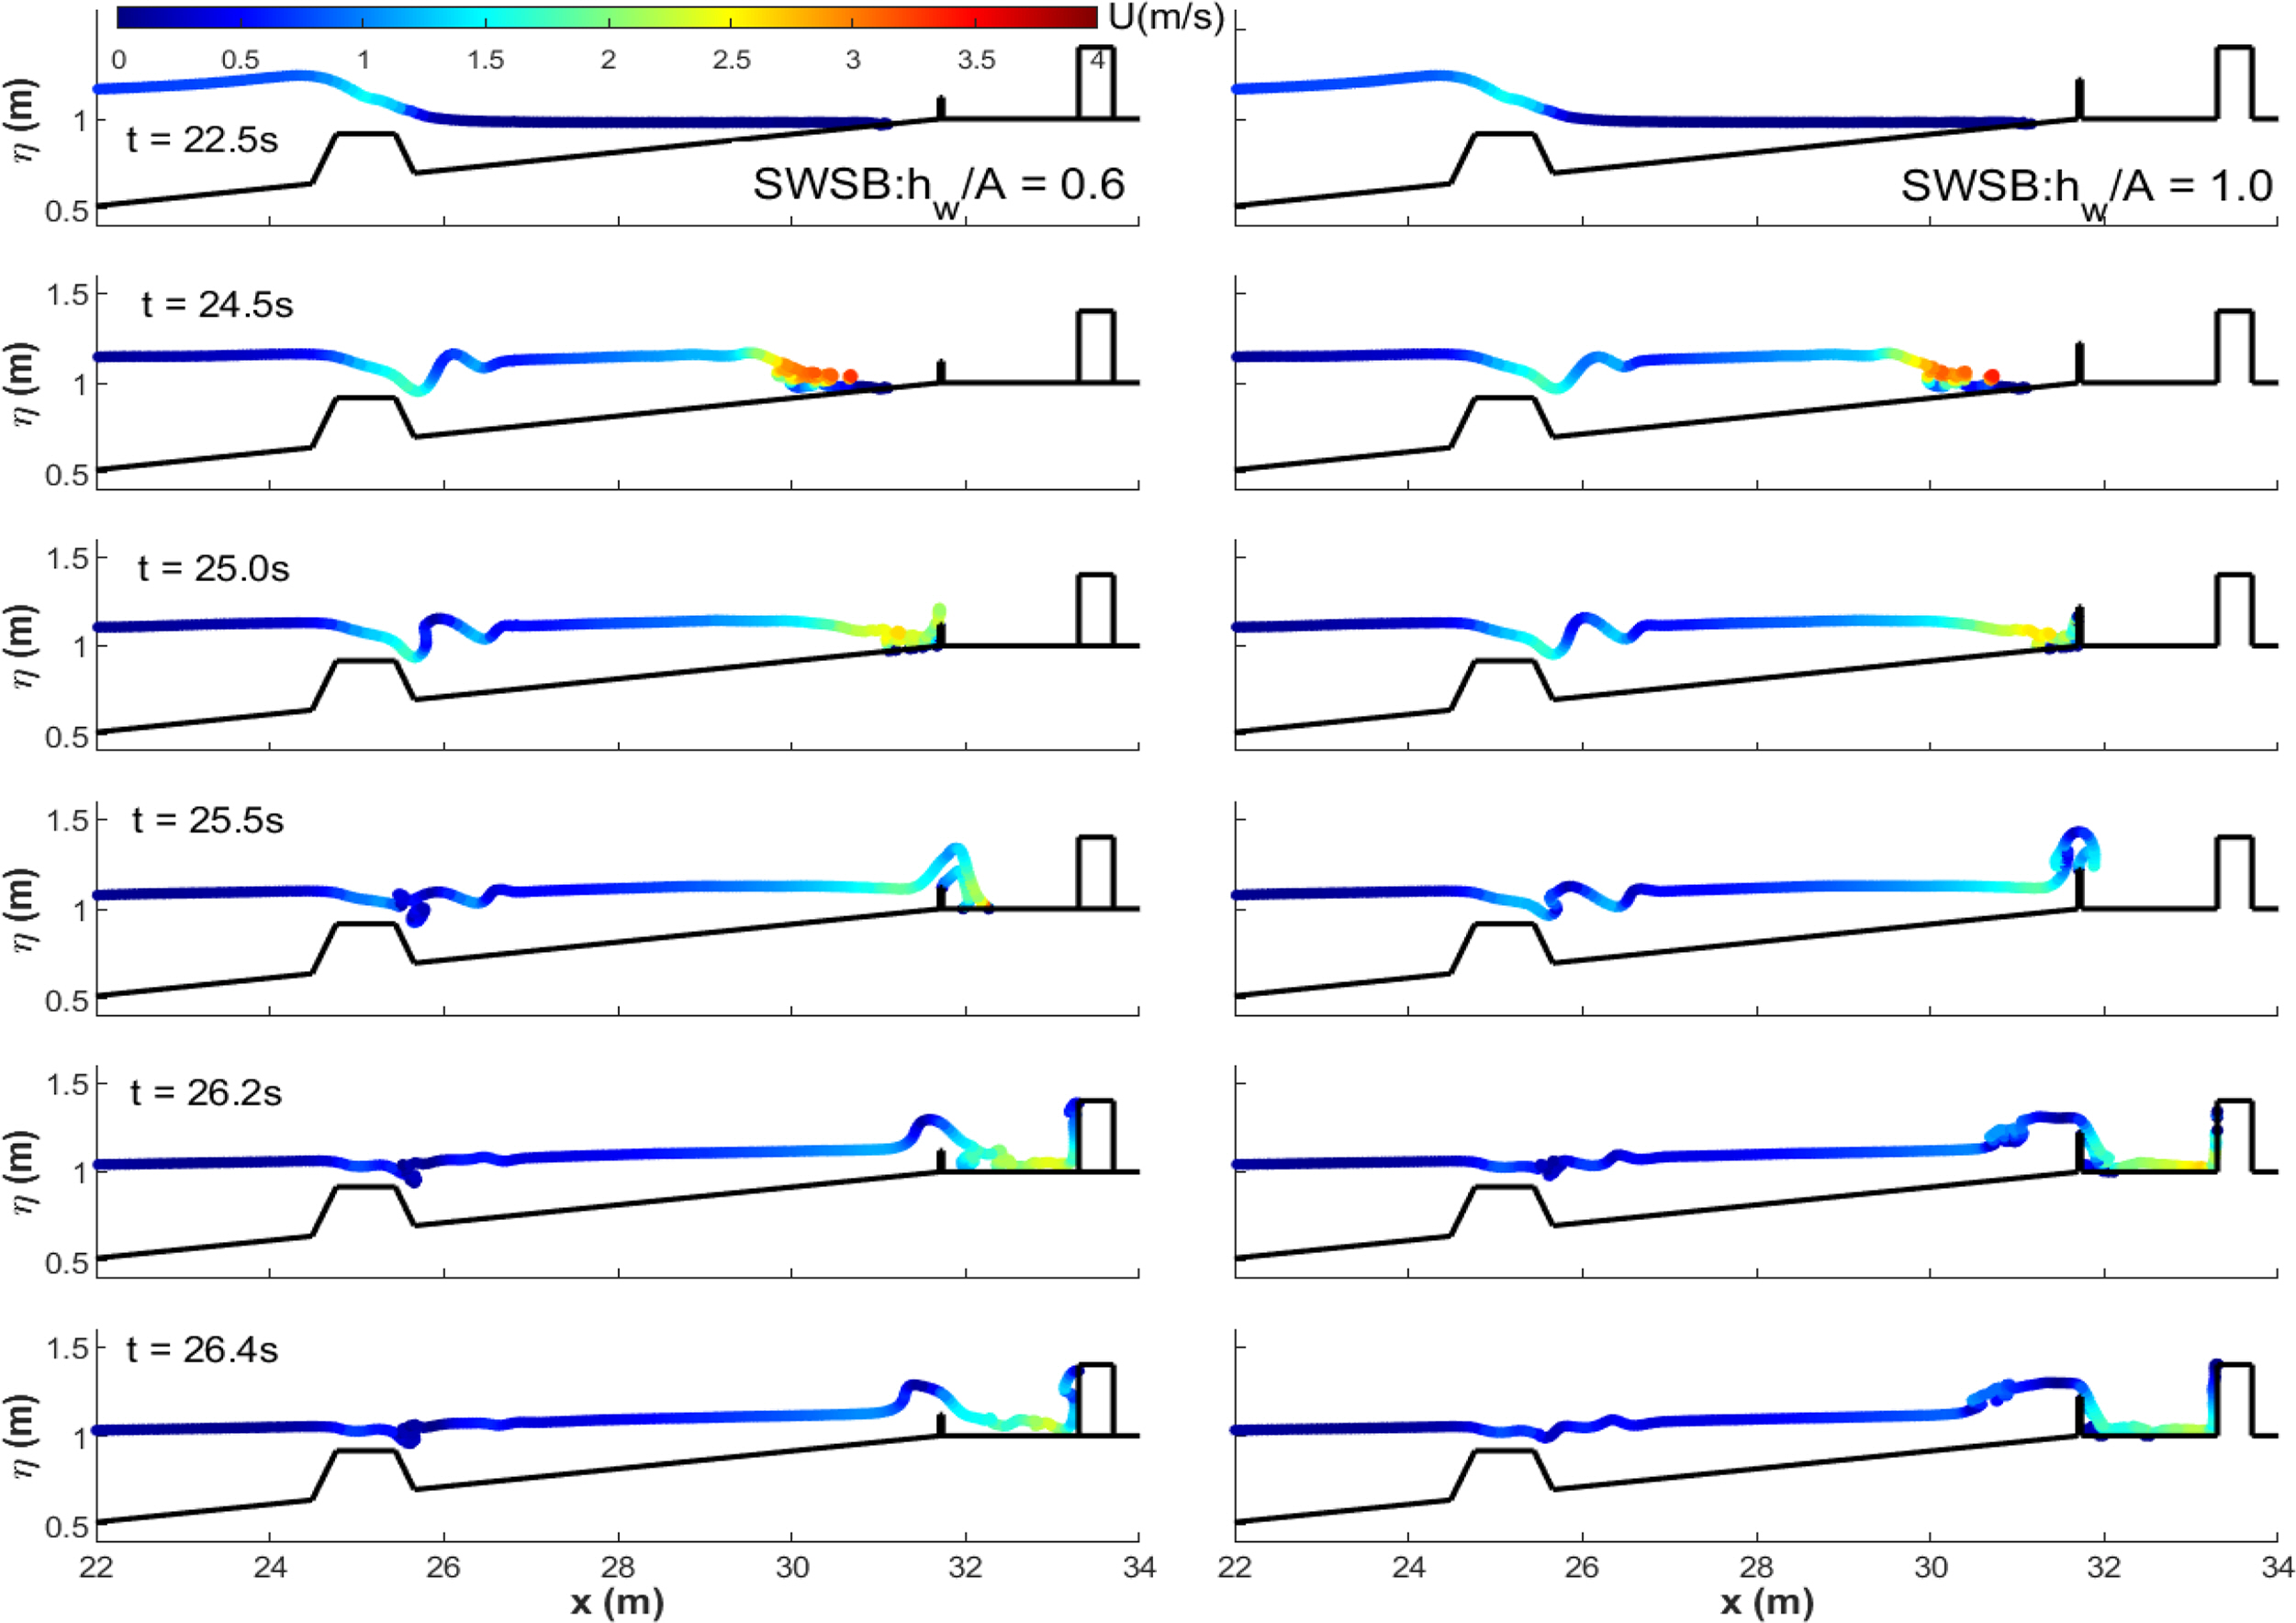
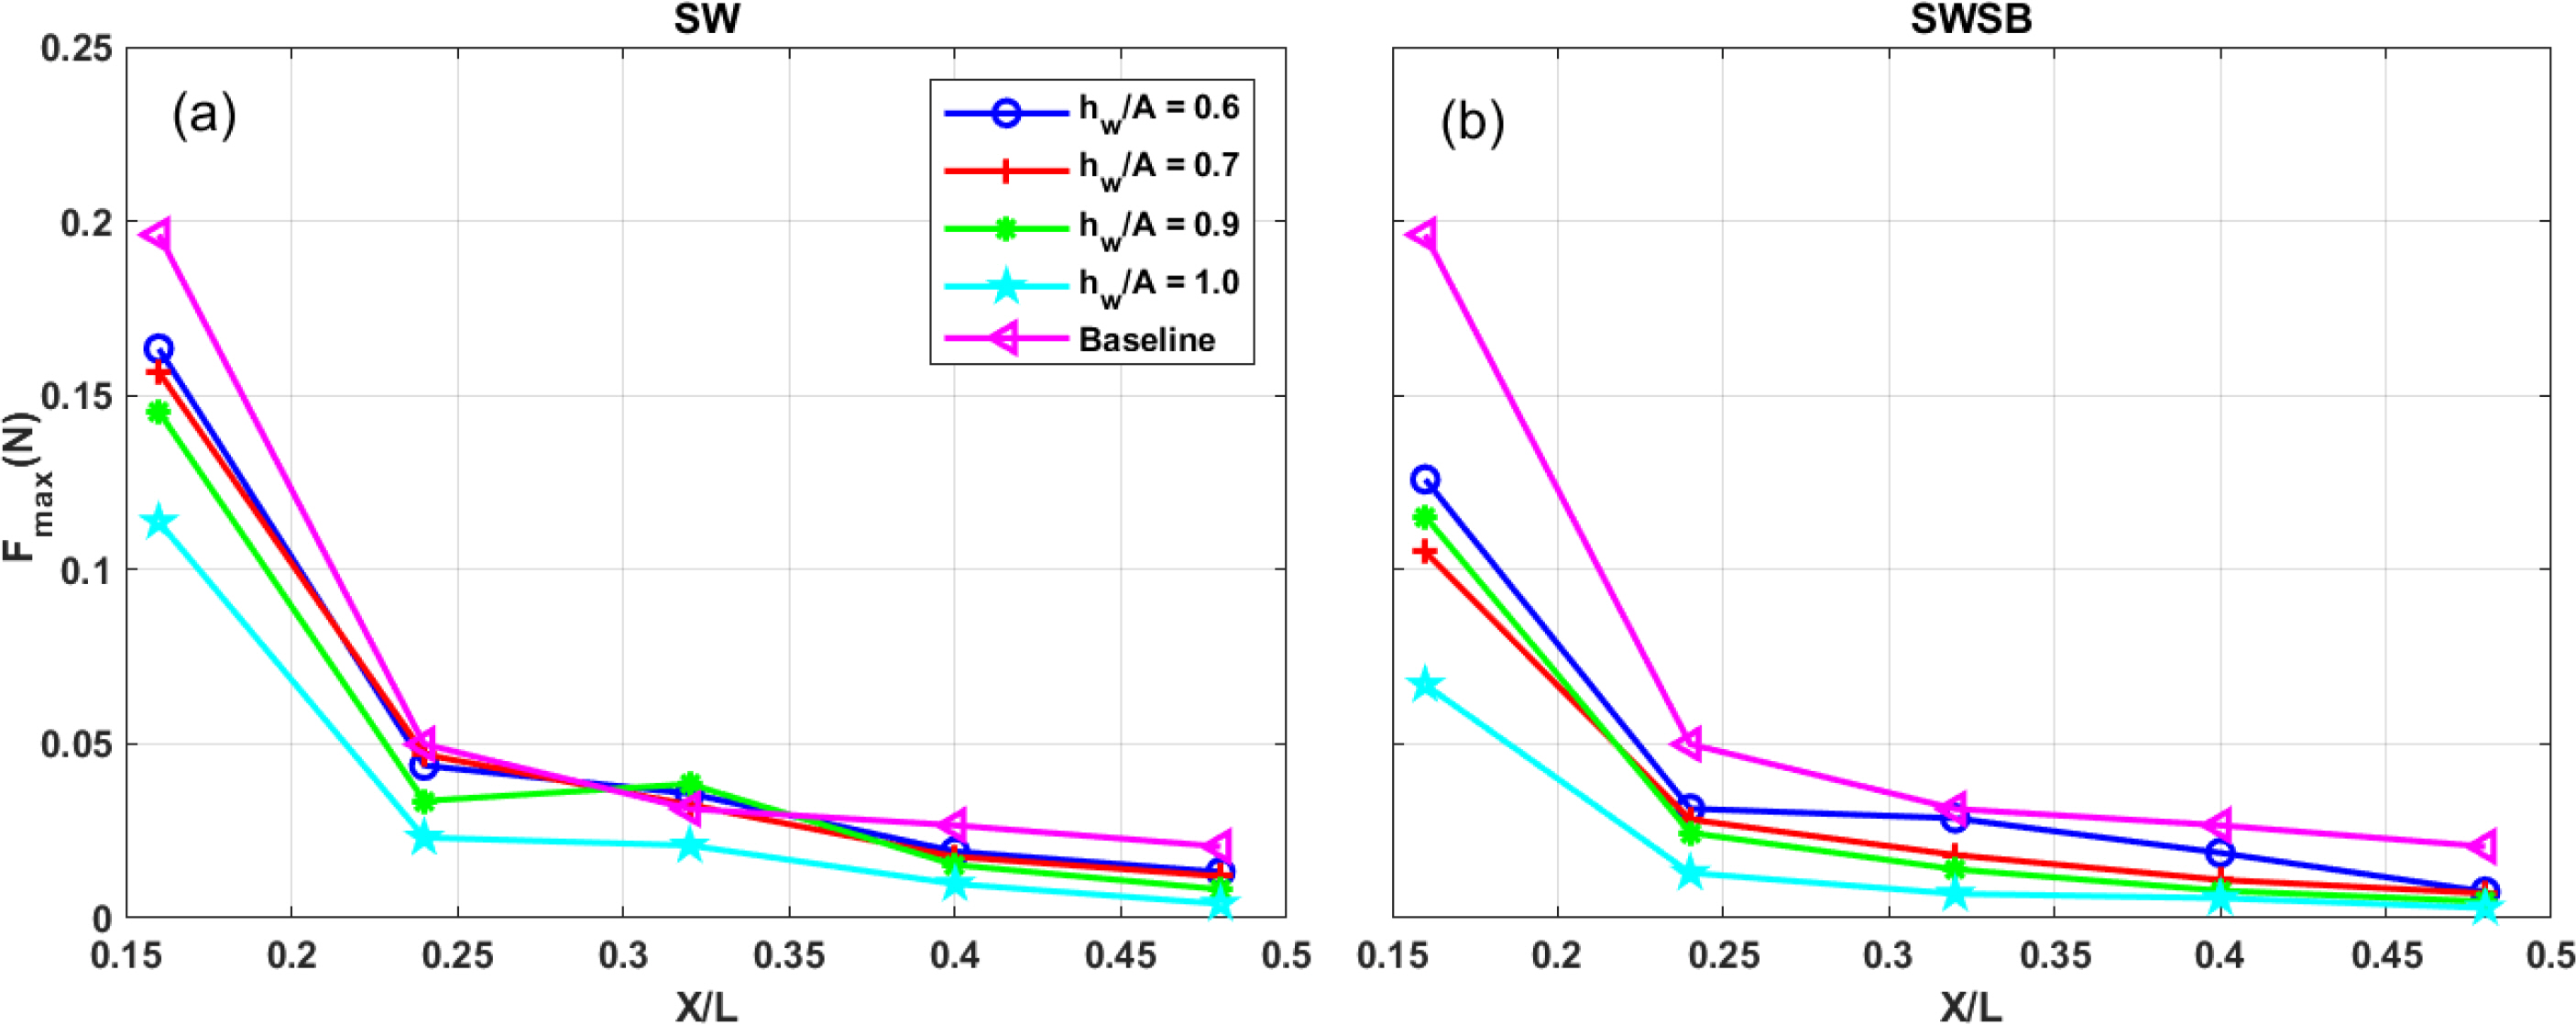
4.3 Effects of Seawall Heights

The effects of seawall height (hw) on the performance of the seawall in reducing the overland flow-induced loads on a series of building arrays have been investigated numerically. Four different seawall heights relative to incident wave amplitude were considered: hw/A = 0.6, 0.7, 0.9 and 1.0. Generally, hw/A was less than or equal to 1 for all trials to ensure significant wave overtopping that can impact coastal communities. At a scale of 1:20, the prototype seawall height would be 2.4 to 4.2 m, which is a typical seawall height found along coasts worldwide. Diagrams of velocity contours at different time instants for the lowest seawall configuration (hw/A = 0.6) and the tallest seawall condition (hw/A = 1.0) for both the SW and SWSB configurations are shown in Figs. 8 and 9, respectively. The condition hw/A of 0.6 is referred to as the low seawall, and hw/A of 1.0 is considered as the tall seawall condition.
The left panels of Fig. 8 shows the water surface elevations corresponding to velocities as a function of cross-shore distances at different time instants for the low seawall condition (hw/A = 0.6), while the right panels of Fig. 8 illustrates the tall seawall condition (hw/A = 1.0) for the SW configuration. The contour data were collected at the cross-section at y = 2.5 m. Firstly, a long wave propagates and starts shoaling at t = 24 s with a steeper and more skewed wavefront along the sloping section, where the maximum velocity was approximately 2.3 m/s. Soon after that, a plunging breaker was generated and characterized by curling wave crests with a high velocity of 3.9 m/s at t = 24.5 s. The snapshots at this time showed that the free surface elevation was entrapped by air, inducing turbulent bores that propagate onshore and then impact the seawall at 25 s.
In the low seawall configuration (hw/A = 0.6), tsunami-like wave overtops the buildings with regions of high velocities, but the tall seawall condition (hw/A = 1.0) induced strong reflected waves at 25.5 s. Runup on a taller seawall may significantly alleviate velocities more than those on the lower seawall. The overland flow inundated the flat area and caused similar runup heights on the front face of the first building row for both configurations at 25.9 s and 26.2 s for the low and tall seawall configurations, respectively. However, the low seawall condition resulted in higher flow depths impinging on the first building rows at t = 25.9 s compared to the thin layer of flow depth for the tall seawall configuration at 31.7 m < x < 33.3 m. This is attributed to the large amount of wave reflected from the tall seawall and propagated offshore.
Fig. 9 presents the effects of seawall heights in the combined structural configurations (SWSB) on the constructed environment. In the SWSB configurations, the dimensions of the submerged breakwater remain unchanged from the original structure in the laboratory experiment. With the installation of the submerged breakwater, the tsunami-like wave shoals and begins slightly breaking over the top crest of the submerged breakwater at t = 24.5 s. At the initial breaking stage, the broken wave traveled down on the lee side of the submerged breakwater with significant surface elevation reduction to −0.015 m (relative to still water level d = 0.98 m) and velocities increasing to 1.5 m/s. Moreover, the lee side showed a hydraulic jump that disturbed the water level, forming turbulence bores propagating over the sloping section and impulsively impinging on the vertical wall.
The submerged breakwater significantly reduced velocities when wave runup occurred on the seawall at t = 25 s compared to the individual SW configuration in Fig. 9. The SWSB configurations induced similar flow propagation patterns to those in the SW configurations in the elevated inland area. However, the snapshots in Fig. 9 at t = 26.2 s illustrate that the SWSB configurations with low and tall seawalls resulted in lower flow depths exerted on vertical buildings than those in the SW-only configurations in the inland area.
Fig. 10 presents the maximum forces measured at the five most seaward building rows at different seawall heights for the SW and SWSB configurations as a function of relative distance X/L. X is the distance from the shoreline to each building array, and L is the full cross-shore length of the elevated coastal area (L = 10 m). As shown in Fig. 10, with the same seawall height, the submerged breakwater can reduce the maximum force by over 20% relative to SW-only configurations in the first building row. Generally, increasing seawall height reduced the maximum baseline forces from 15% (for hw/A = 0.6) to 45% (for hw/A = 1.0), while the SWSB configuration resulted in reductions of maximum forces of between 35% and 65%.
Maximum forces monotonically decreased with increasing the relative distance X/L. From the first to the second row (0.16 < X/L < 0.24), maximum forces significantly decreased because the first building row extensively dissipated wave energies of incident overland flows. However, there was a gradual alleviation in maximum forces recorded from the second row to the last row.

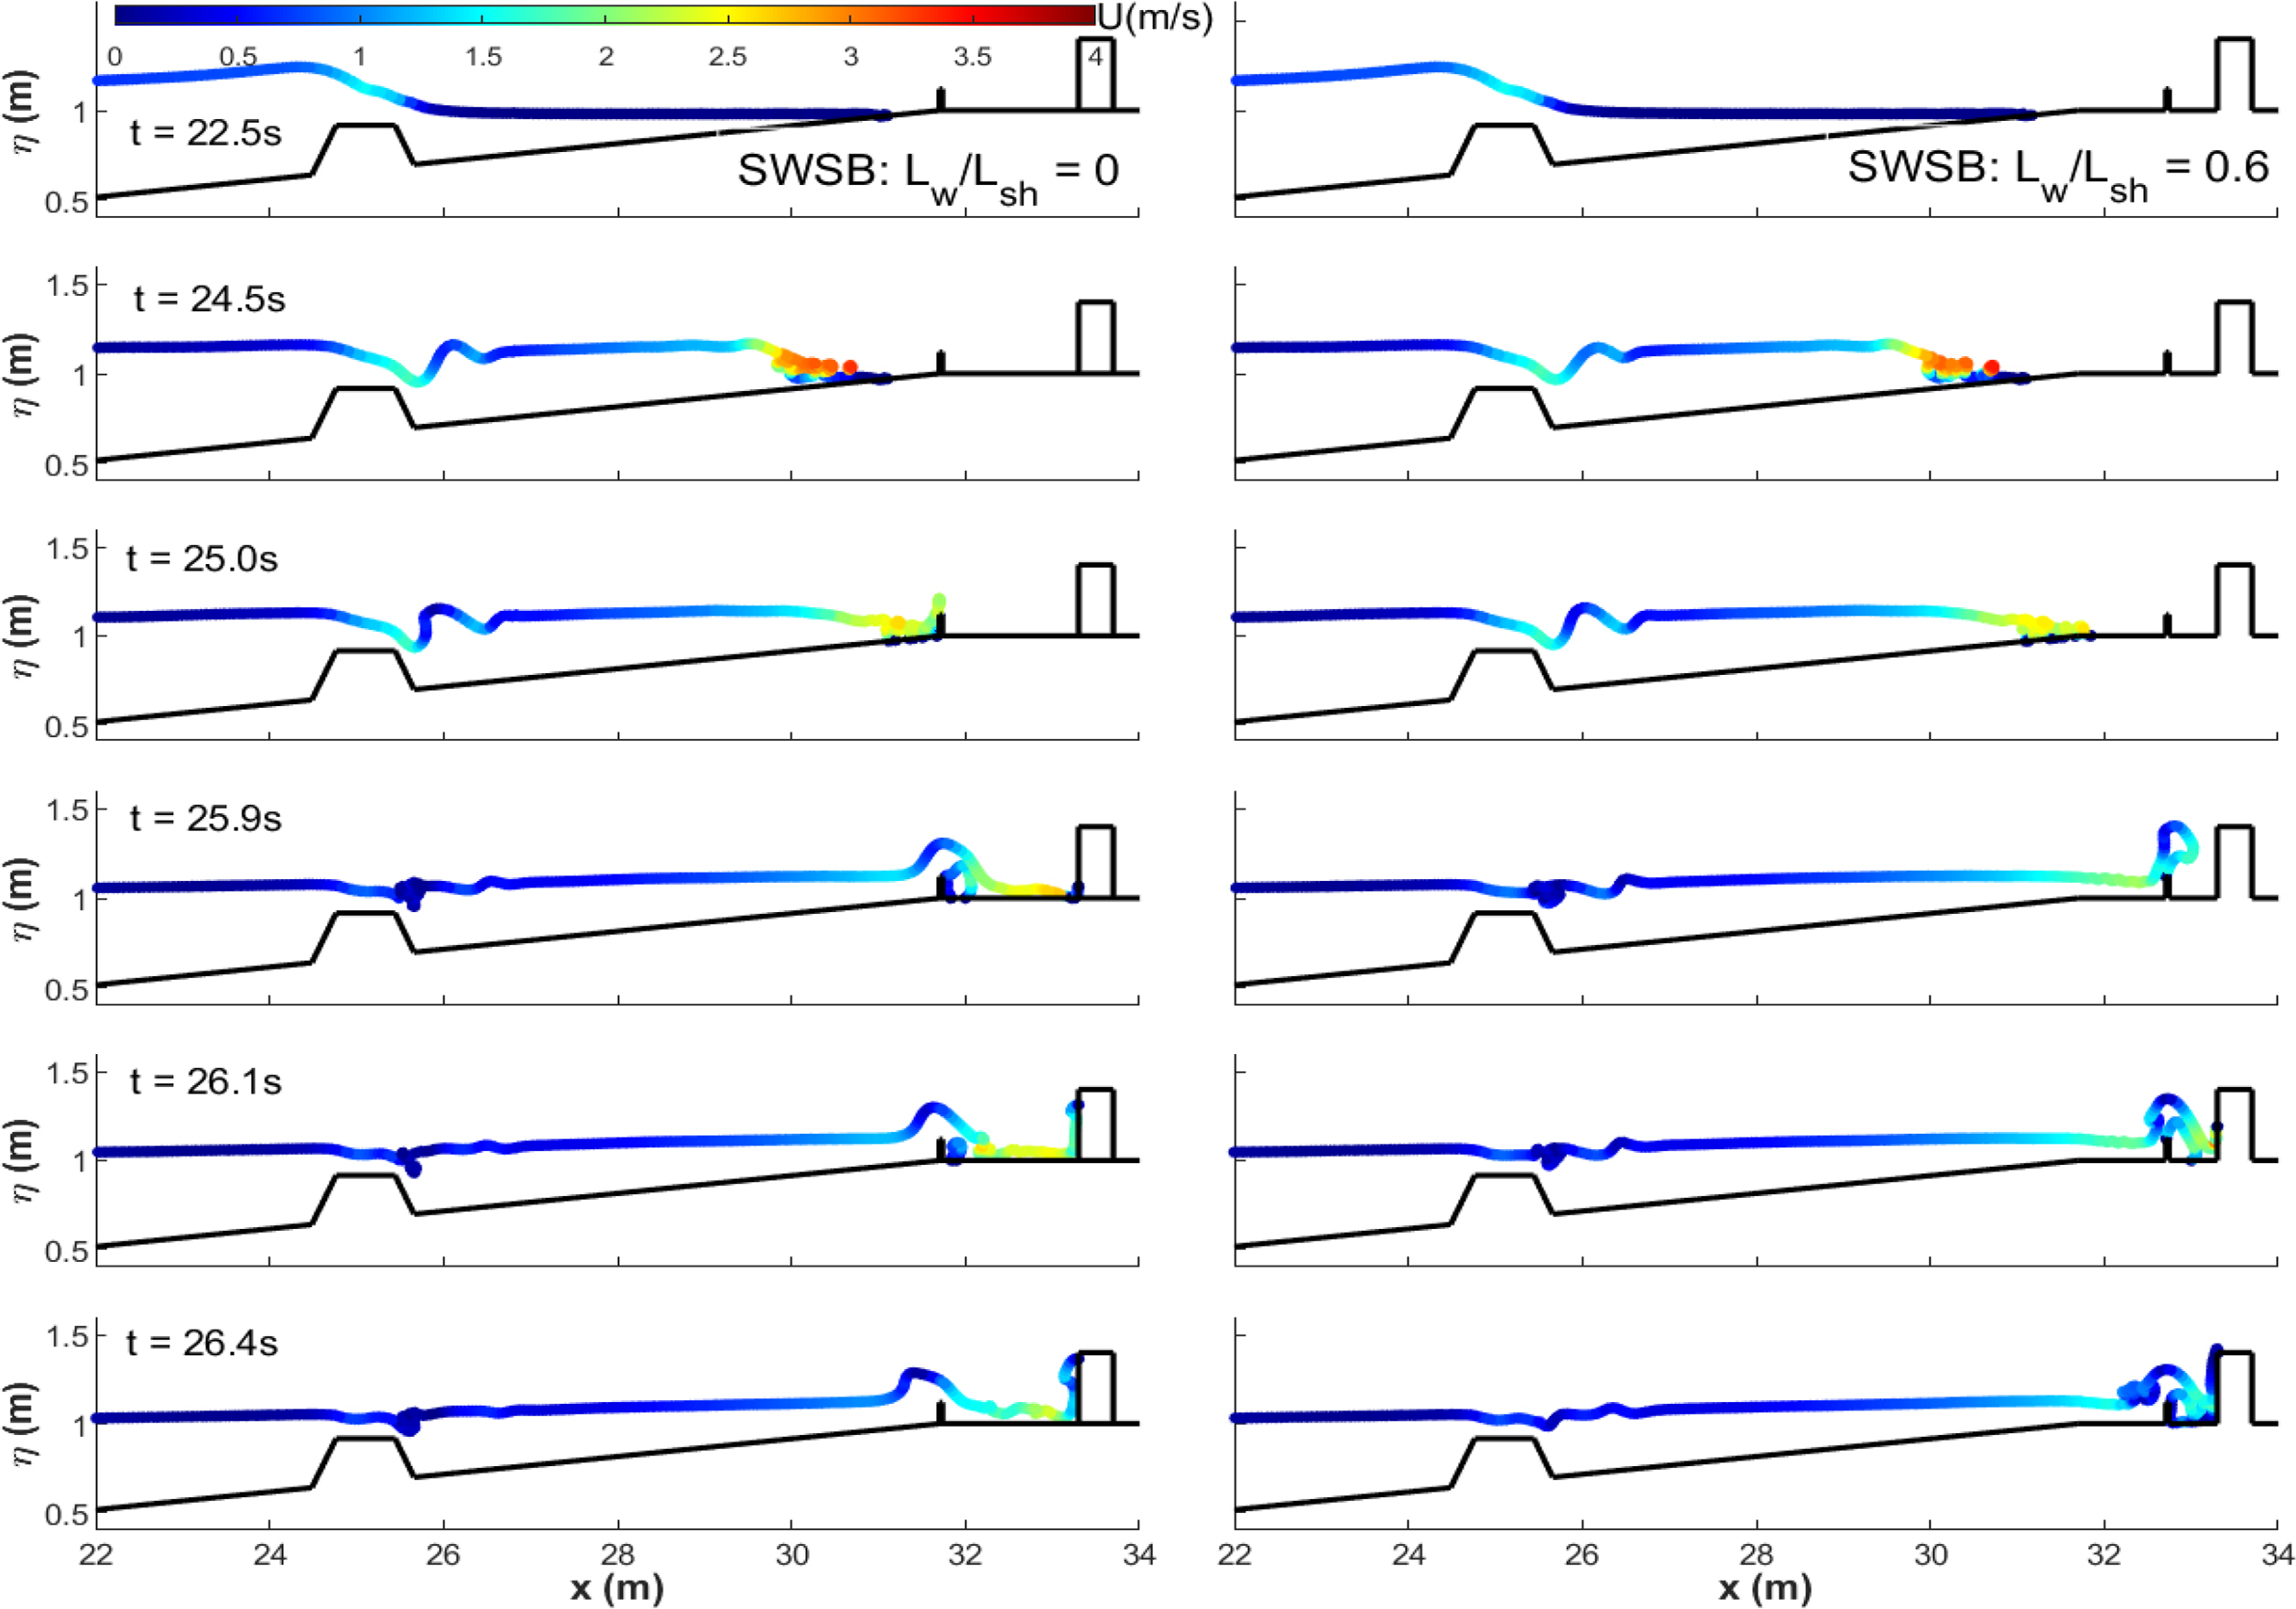
4.4 Effects of Seawall Positions

The effects of seawall positions between the shoreline and the first building row on the performance of structural configurations in reducing hydrodynamics and forces exerted on building elements were numerically investigated by considering four locations of the seawall: Lw/Lsh = 0, 0.4, 0.5, and 0.6. Lw is the distance from the shoreline to each position of the seawall (Lw = 0 for the seawall located on the shoreline), and Lsh is the distance from the shoreline to the first building row (Lsh = 1.6 m). Geometrical dimensions of the seawall and submerged breakwater are similar to those in the experiment.
The left panels of Figs. 1112 compare the velocity contour at different time instants for the original seawall and closer location to the first building row (right panels of Figs. 1112) in the SW-only and combined SWSB configurations. As shown in Figs. 11 and 12, there are different wave propagation characteristics in each configuration. For SW configurations with Lw/Lsh = 0, overland flow extensively broke in the flat area, and then the wave energies were significantly dissipated before reaching a building element. However, a closer seawall to the first building row (Lw/Lsh = 0.6) resulted in larger wave overtopping from the seawall at 25.5 s, which directly impinged on the first building row (t = 26 s) compared to the seawall at the shoreline location (Lw/Lsh = 0). Therefore, a low-lying seawall located close to the building may induce a higher flow depth and velocity.
Fig. 13 shows the maximum force versus the relative distance X/L at the four varied seawall positions compared to the baseline condition in both the SW and SWSB configurations. Although the seawall can reduce the maximum baseline forces, installing the seawall near the most seaward building row may amplify maximum horizontal forces compared to the original seawall location on the shoreline. The closer seawall configuration resulted in amplifications of up to 21% and 25% at Lw/Lsh = 0.6 for the SW-only and SWSB compared to the configurations with the seawall located at the shoreline. However, these configurations reduced baseline forces by approximately 5% and 25%, respectively.

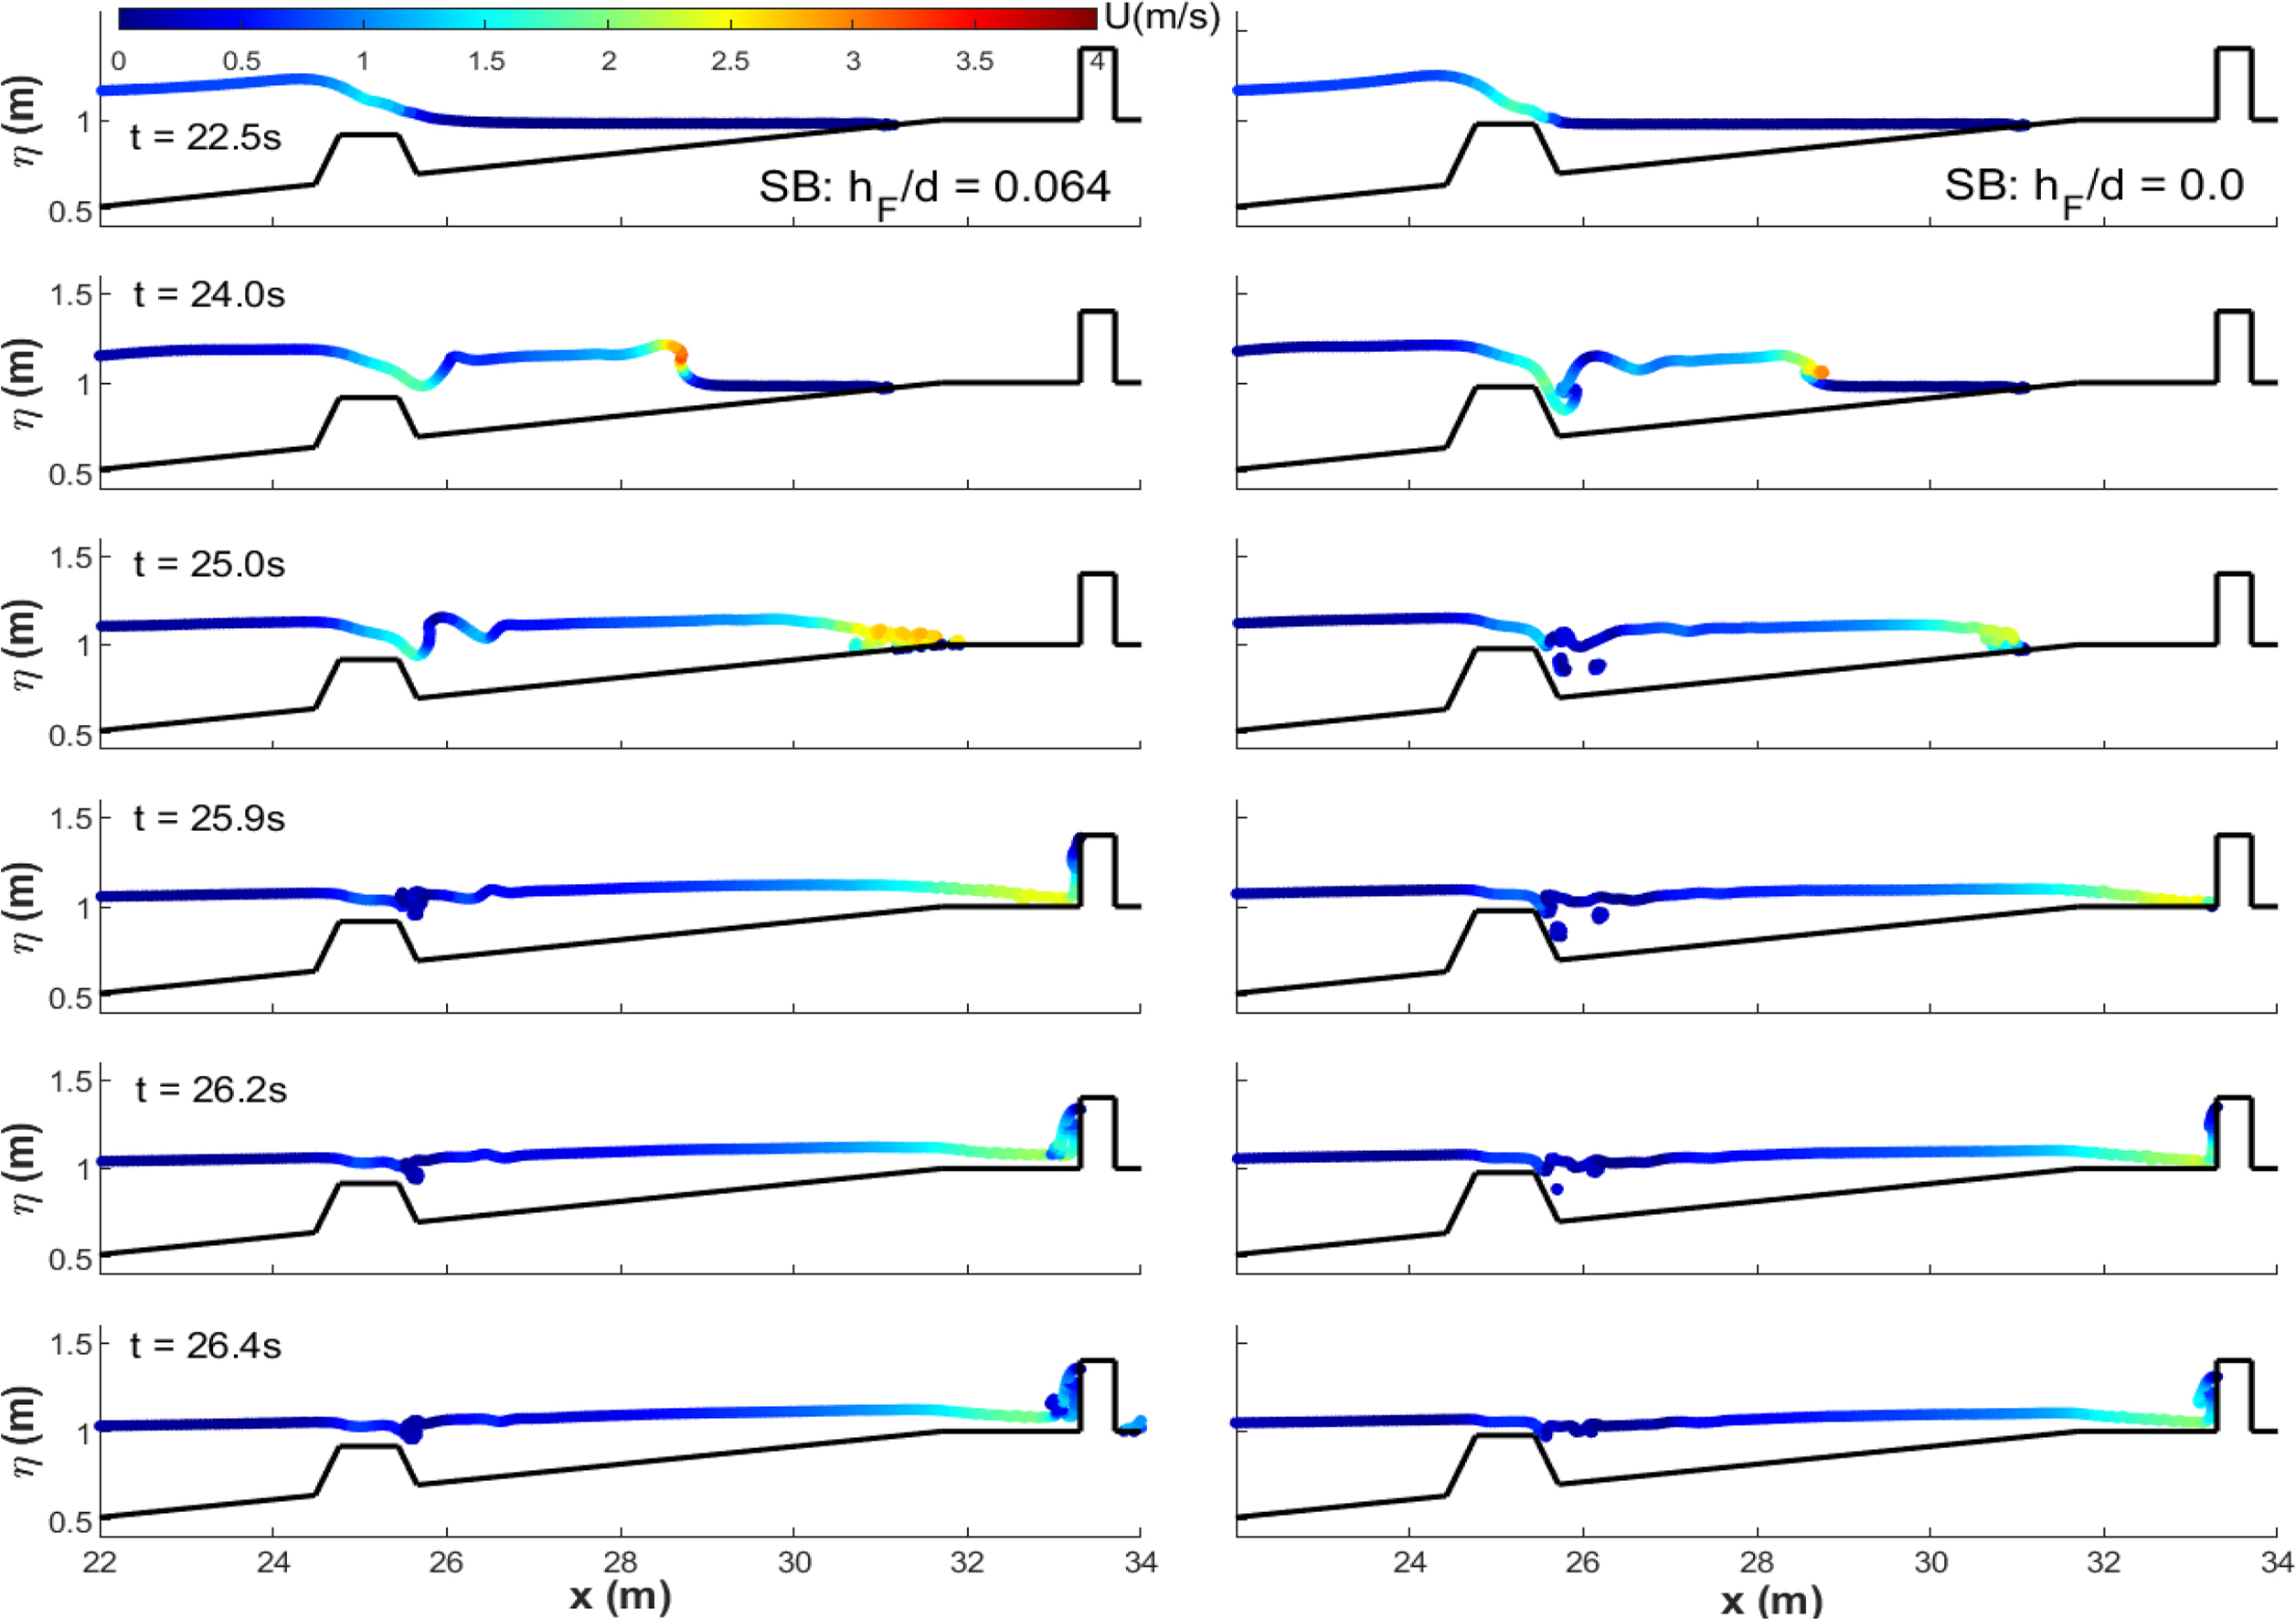
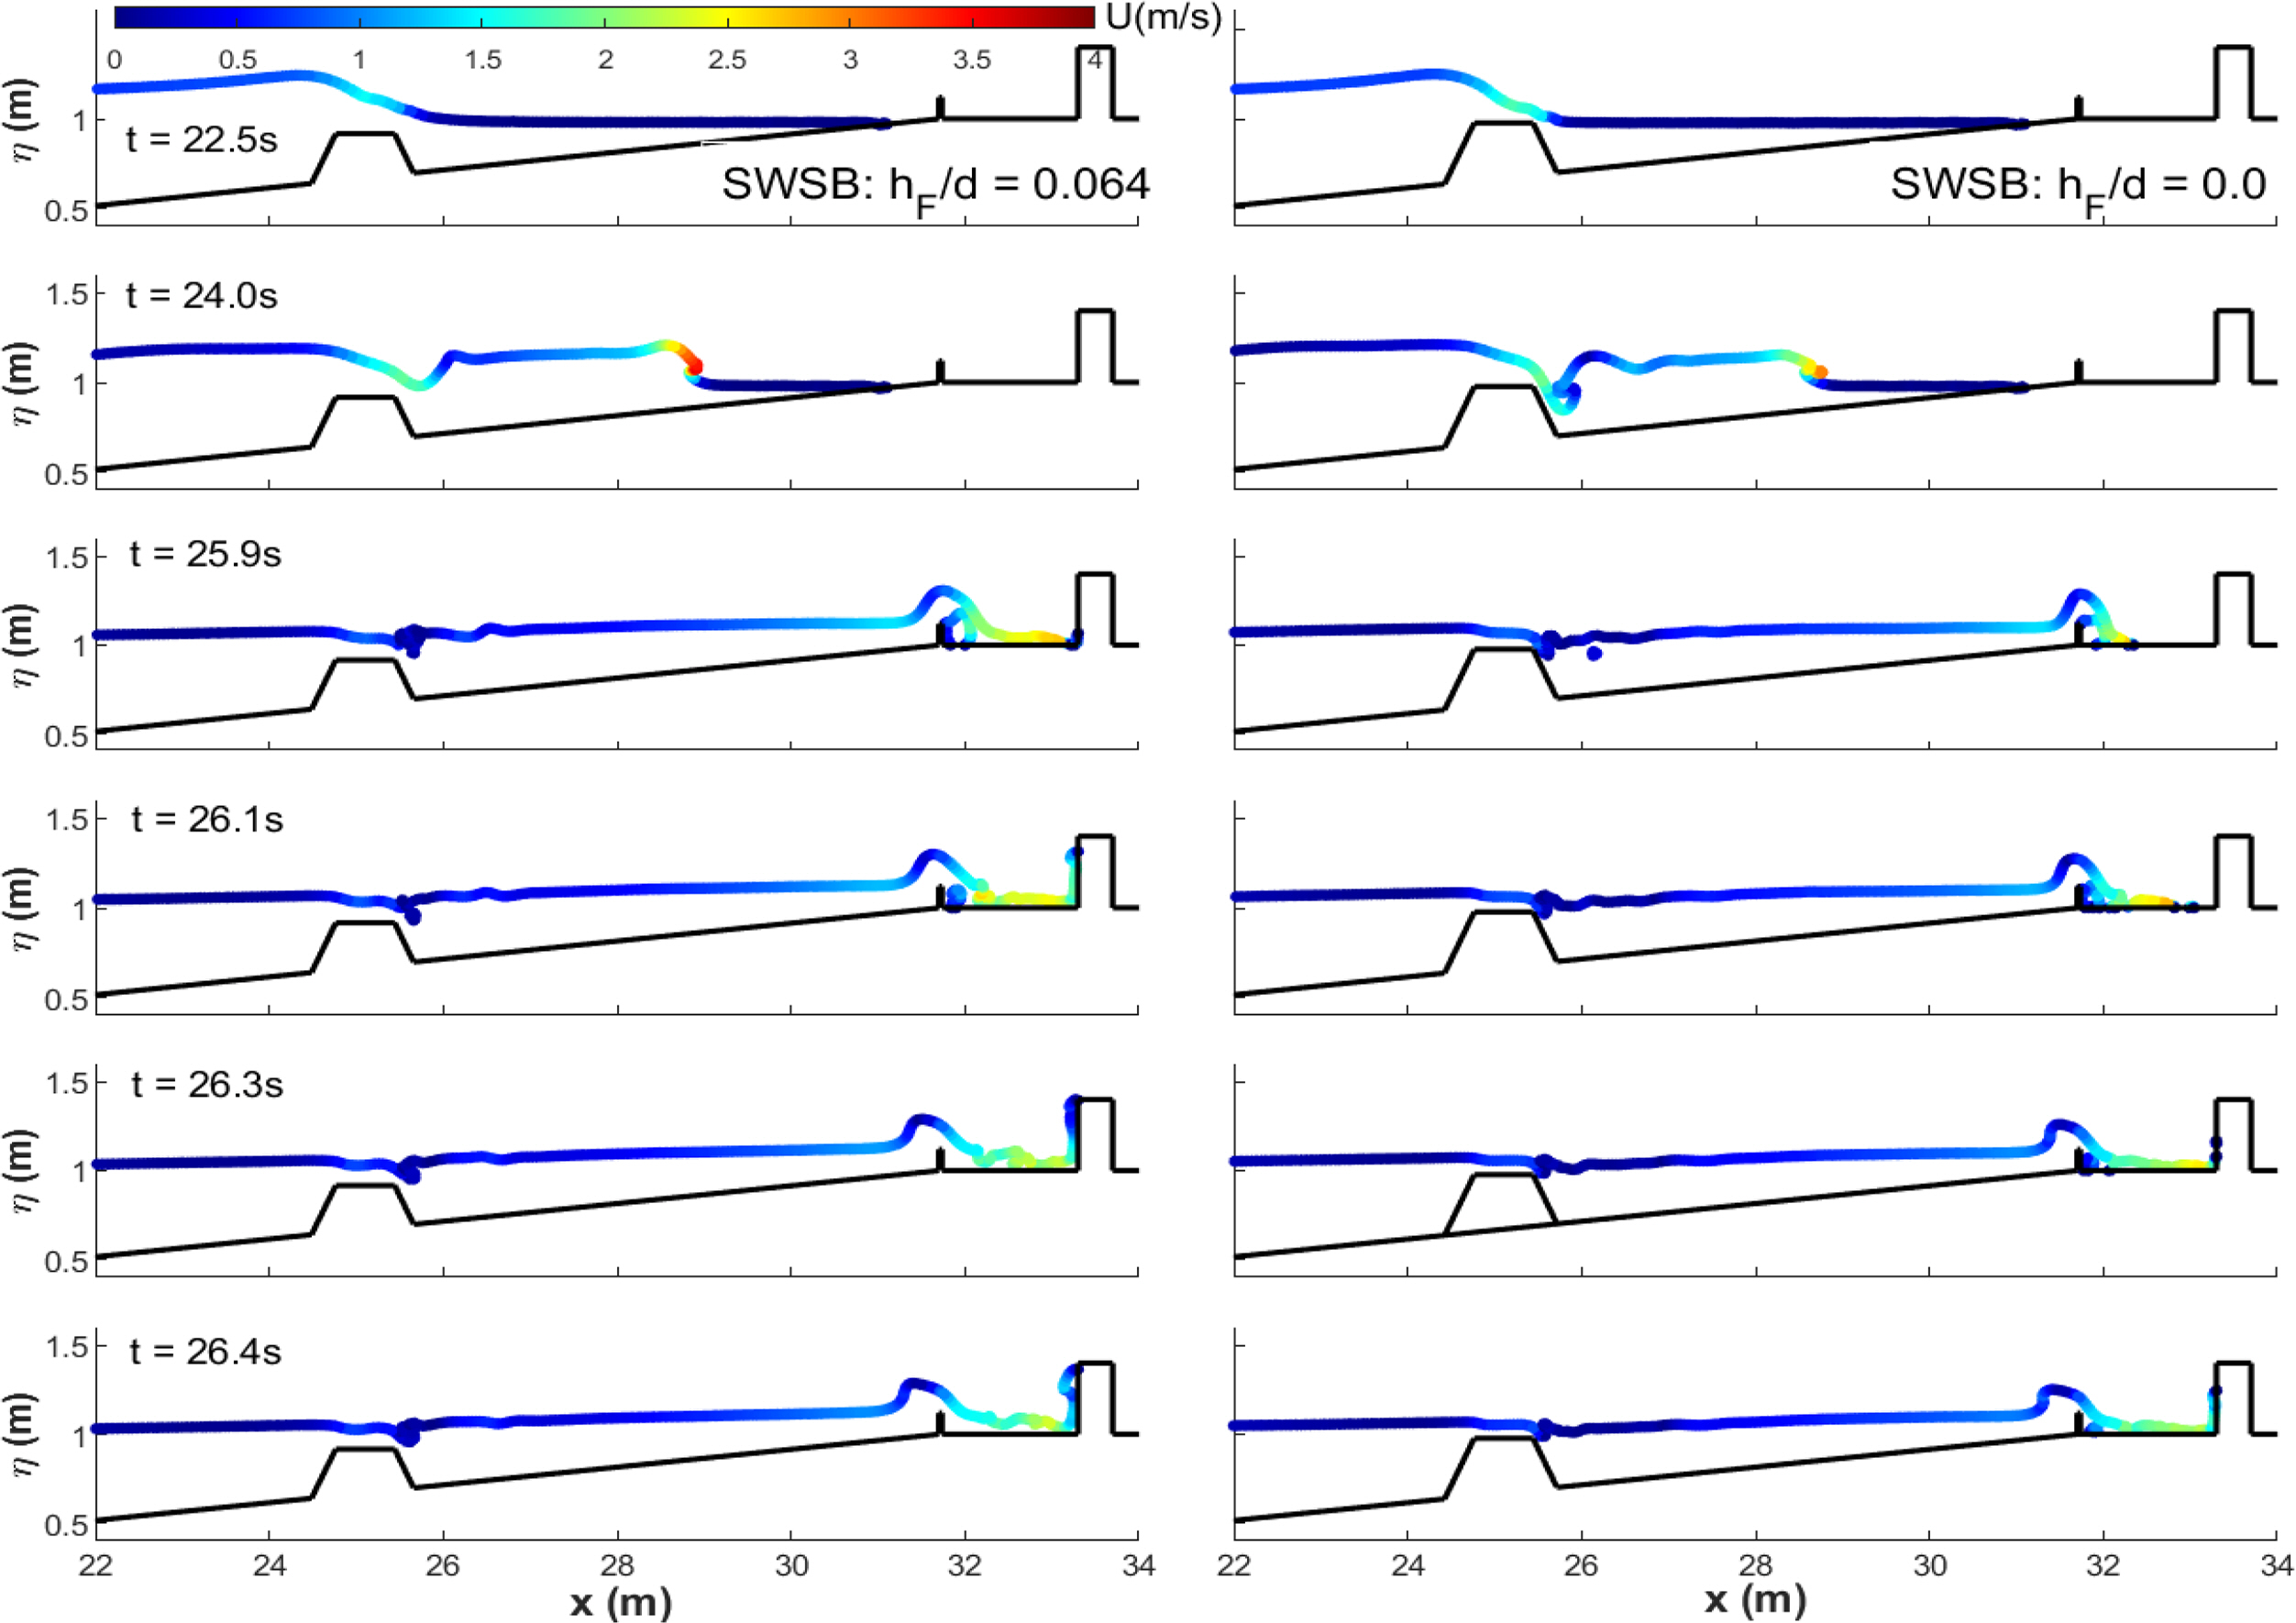
4.5 Effects of Submerged Breakwater Freeboards

Four different freeboard ratios of submerged breakwater were selected to examine the effects of submerged breakwaters on reducing maximum forces in a series of building arrays: hF/d = 0.064, 0.044, 0.024, and 0. The water level (d) was fixed at 0.98 m. The freeboard linearly decreased from the original freeboard used in the laboratory (hF/d = 0.064) to the still water level (hF/d = 0). The dimensions of the seawall in the SWSB are similar to the original seawall’s (hw = 0.12 m) in the experiment.
Figs. 14 and 15 show snapshots of velocity contours at the original freeboard (hF/d = 0.064) and lowest freeboard (hF/d = 0) for the SB-only and SWSB configuration at six time instants. As seen in the figures, the freeboard significantly influences overland flow hydrodynamics. The lower freeboard condition (higher submerged breakwater) caused tsunami-like waves to travel down deeper on the lee side of the submerged breakwater, inducing turbulent bores with lower surface elevations of 0.17 m (relative to still water level) and velocities of 2.23 m/s, compared to 0.23 m, and 3.25 m/s in the original freeboard condition, respectively, at t = 24 s. In the inland area, the submerged breakwater with freeboard condition (hF/d = 0) caused a smaller wave runup climbing up the front face of the first building array. Similarly, the addition of the seawall also diminished the inundation level influencing the vertical building (Fig. 15). Therefore, lowering the freeboard reduced flow depths and velocities in front of building rows.
Fig. 16 compares the maximum forces measured in different freeboard configurations. As discussed, shorter freeboards considerably reduced the onshore inundation depth and velocity, inducing lower maximum forces on a series of vertical building arrays. In the SB-only configuration, submerged breakwater reduced baseline forces by 24%, 28%, 42%, and 50% for the conditions of hF/d = 0.064, 0.044, 0.024, and 0, respectively. Moreover, the addition of the seawall can reduce them by approximately 20% more than the corresponding freeboard in the SB configuration. Therefore, the lowest freeboard condition in the SWSB configuration mitigated baseline forces by 70%.

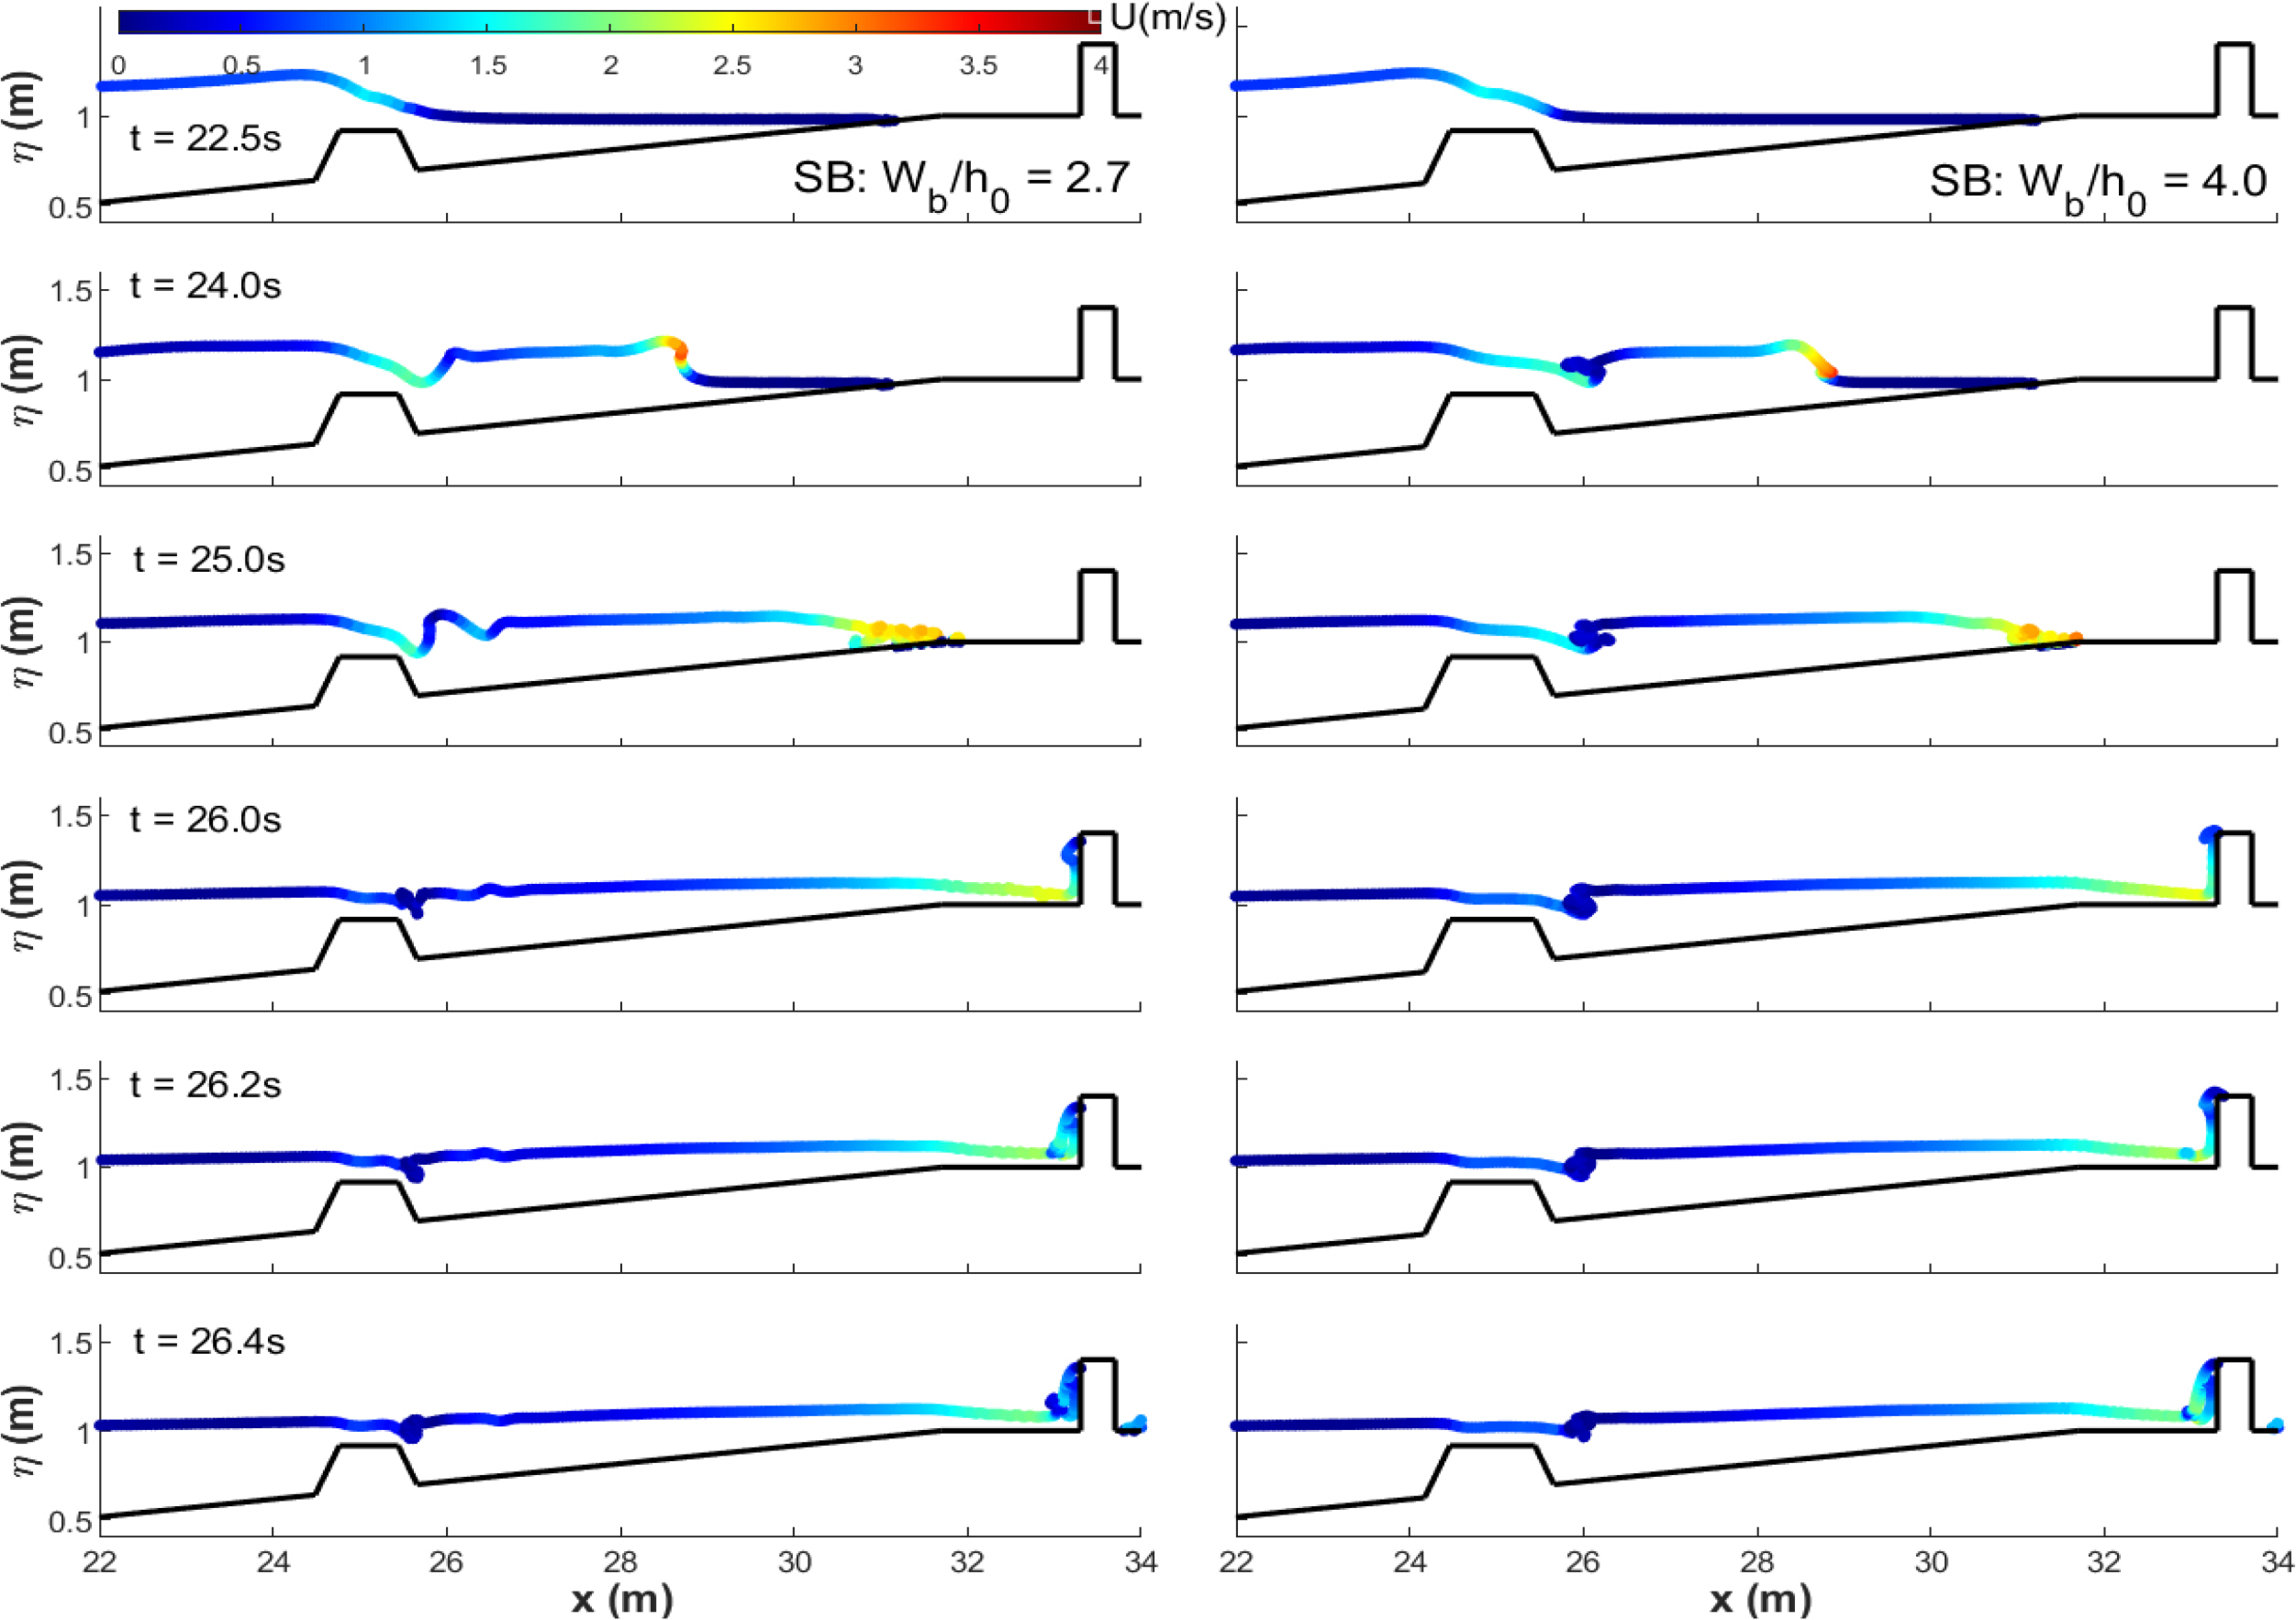
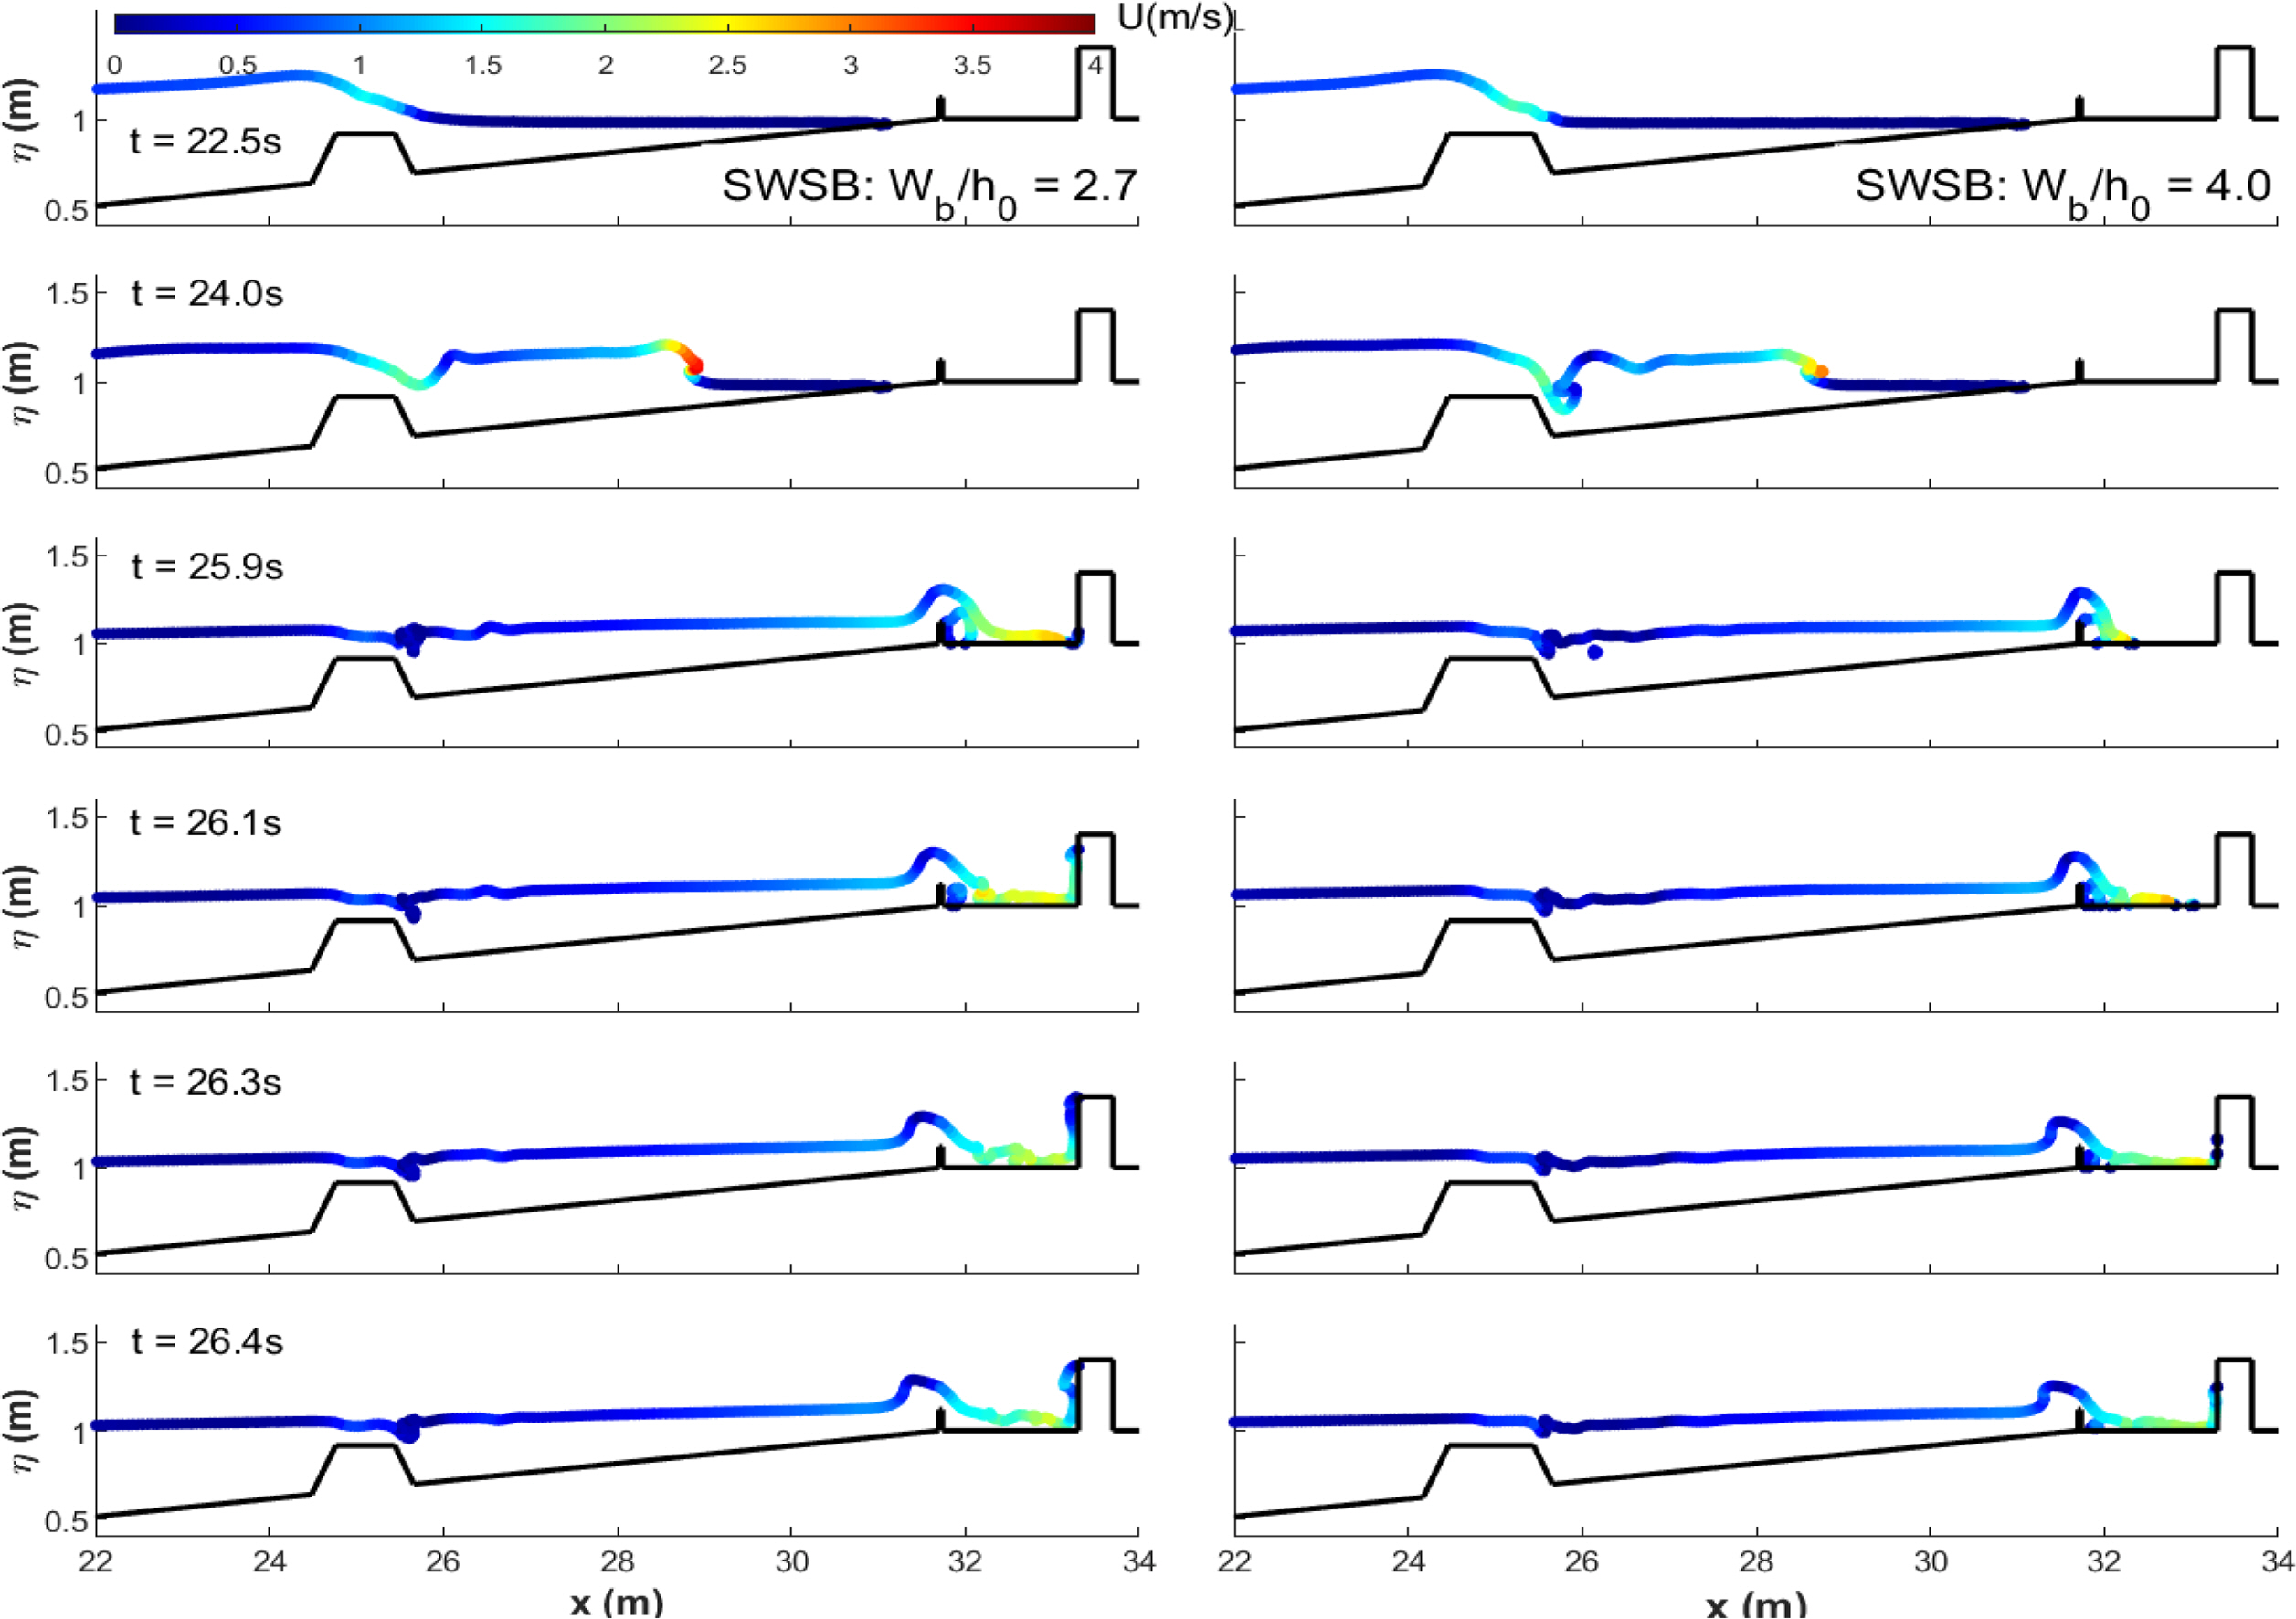
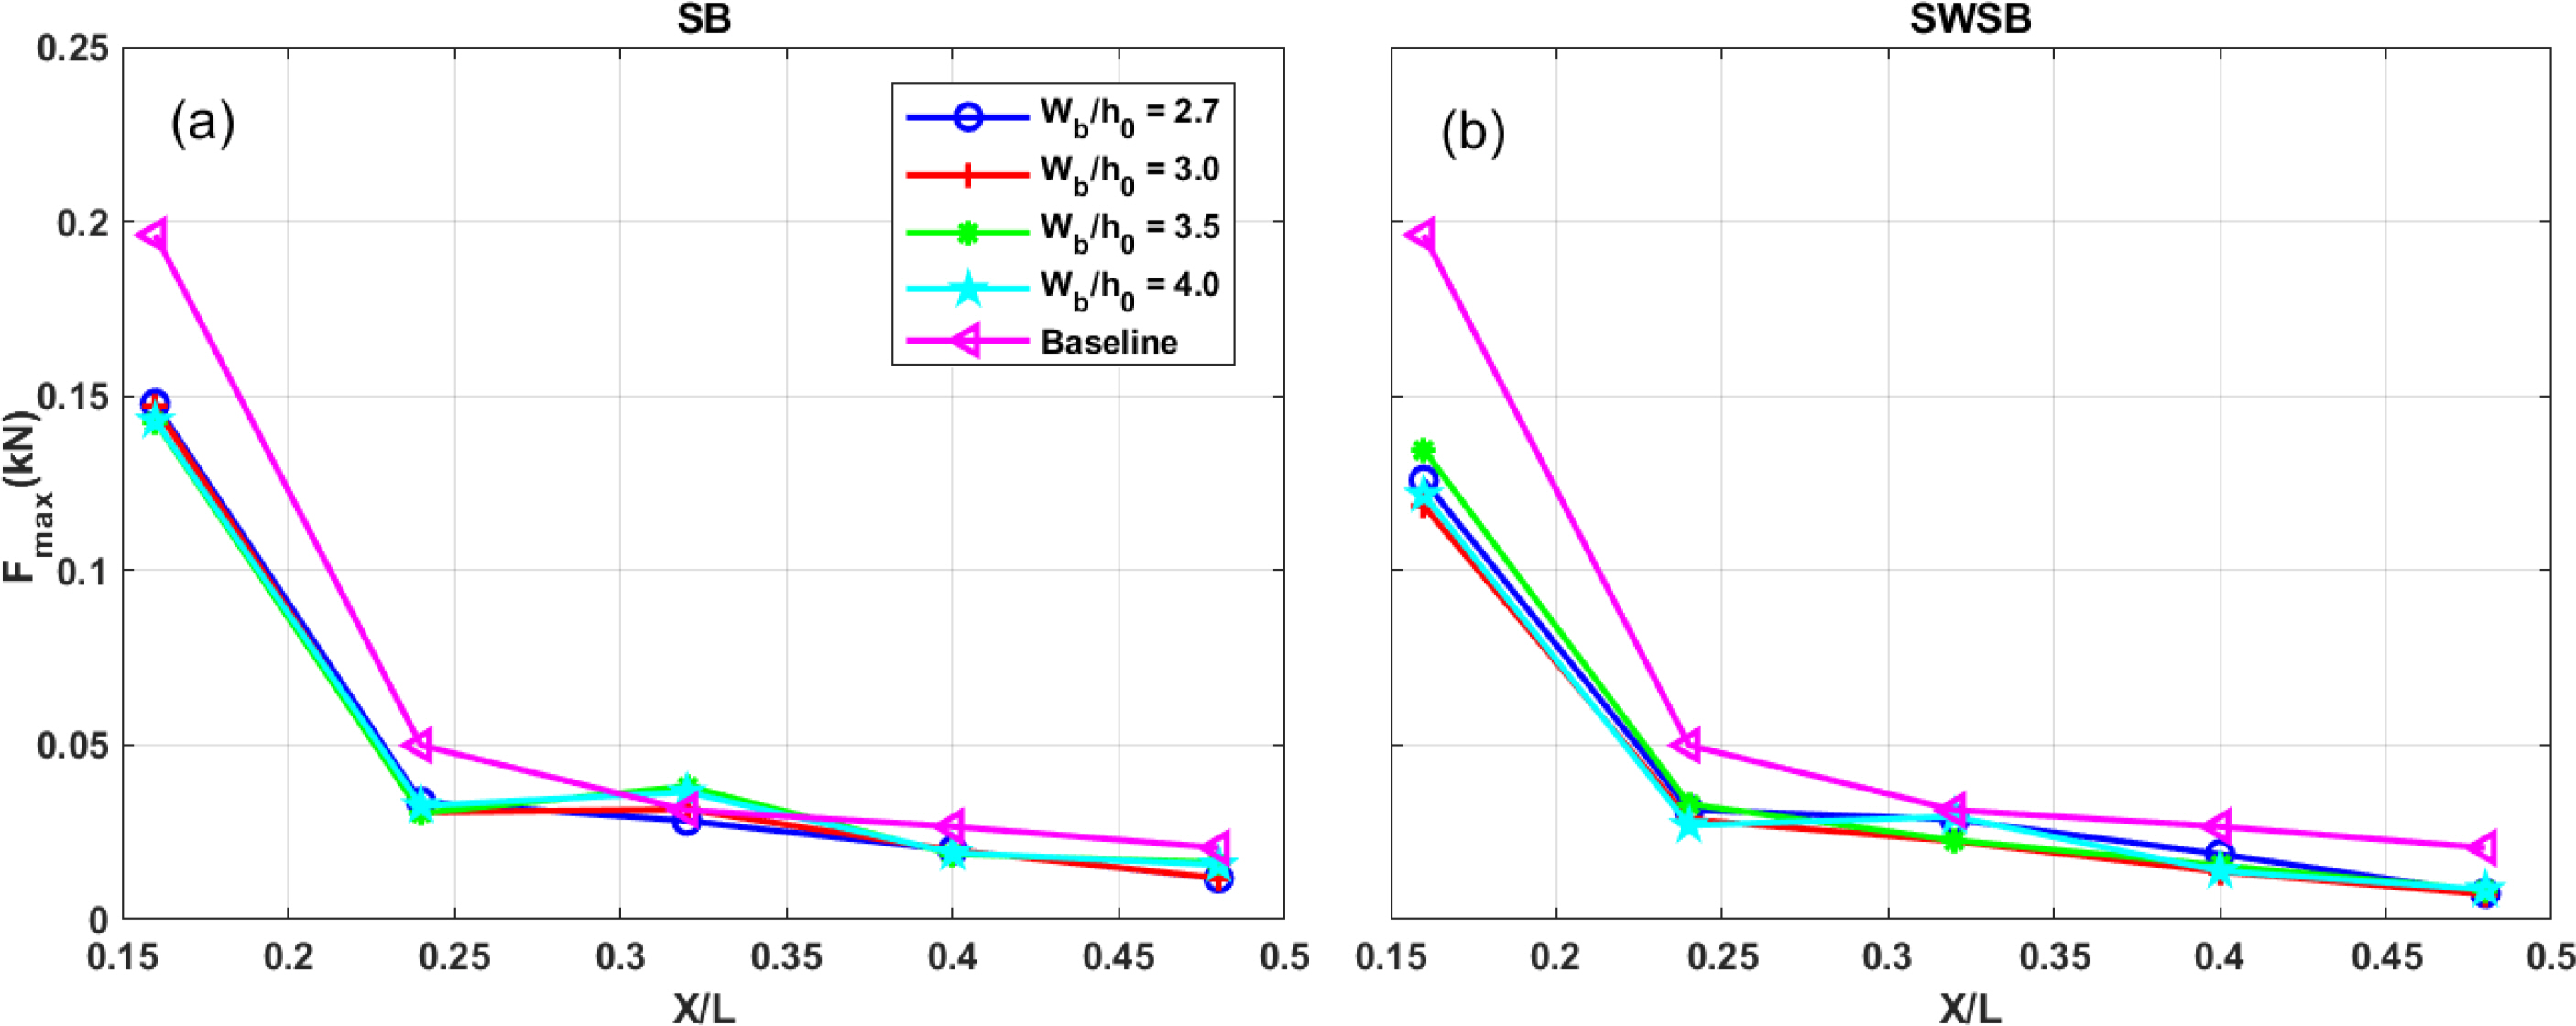
4.6 Effects of Submerged Breakwater Crest Widths

The influences of crest widths (Wb) on the performance of submerged breakwater in reducing the overland flow loading on a series of building arrays were studied. Four crest widths were selected: Wb/h0 = 2.7, 3.0, 3.5, and 4.0. h0 is the height from the crest of the submerged breakwater to the middle of the bottom (h0 = 0.25 m) (Fig. 1). The incident wave height was kept at 0.21 m, the water level is set at 0.98 m, and the dimensions of the seawall remained the same.
As shown in Fig. 17, the influences of crest widths on hydrodynamics in the SB-only configuration at different time instants are very limited. Slight differences in hydrodynamic flow patterns occurred with the seawall as an additional shielding structure (Fig. 18). The overland flow was generated by long-period waves, but all crest widths of the submerged breakwater are significantly shorter compared to the period of flow, inducing a non-significant reduction for each crest width (Fig. 19). The submerged breakwater with different crest widths reduced maximum baseline forces by 25% and 38% in the SB-only and SWSB configurations, similar to the original structural conditions (Wb/h0 = 2.7) in the laboratory experiment.

5. Conclusions

This study numerically examined the effects of a seawall and submerged breakwater on flow depths, velocities, and forces on a series of building rows in the constructed environment respecting varied heights and positions of the seawall, elevations of freeboards, and crest widths of the submerged breakwater. The primary findings of this paper are summarized as follows:
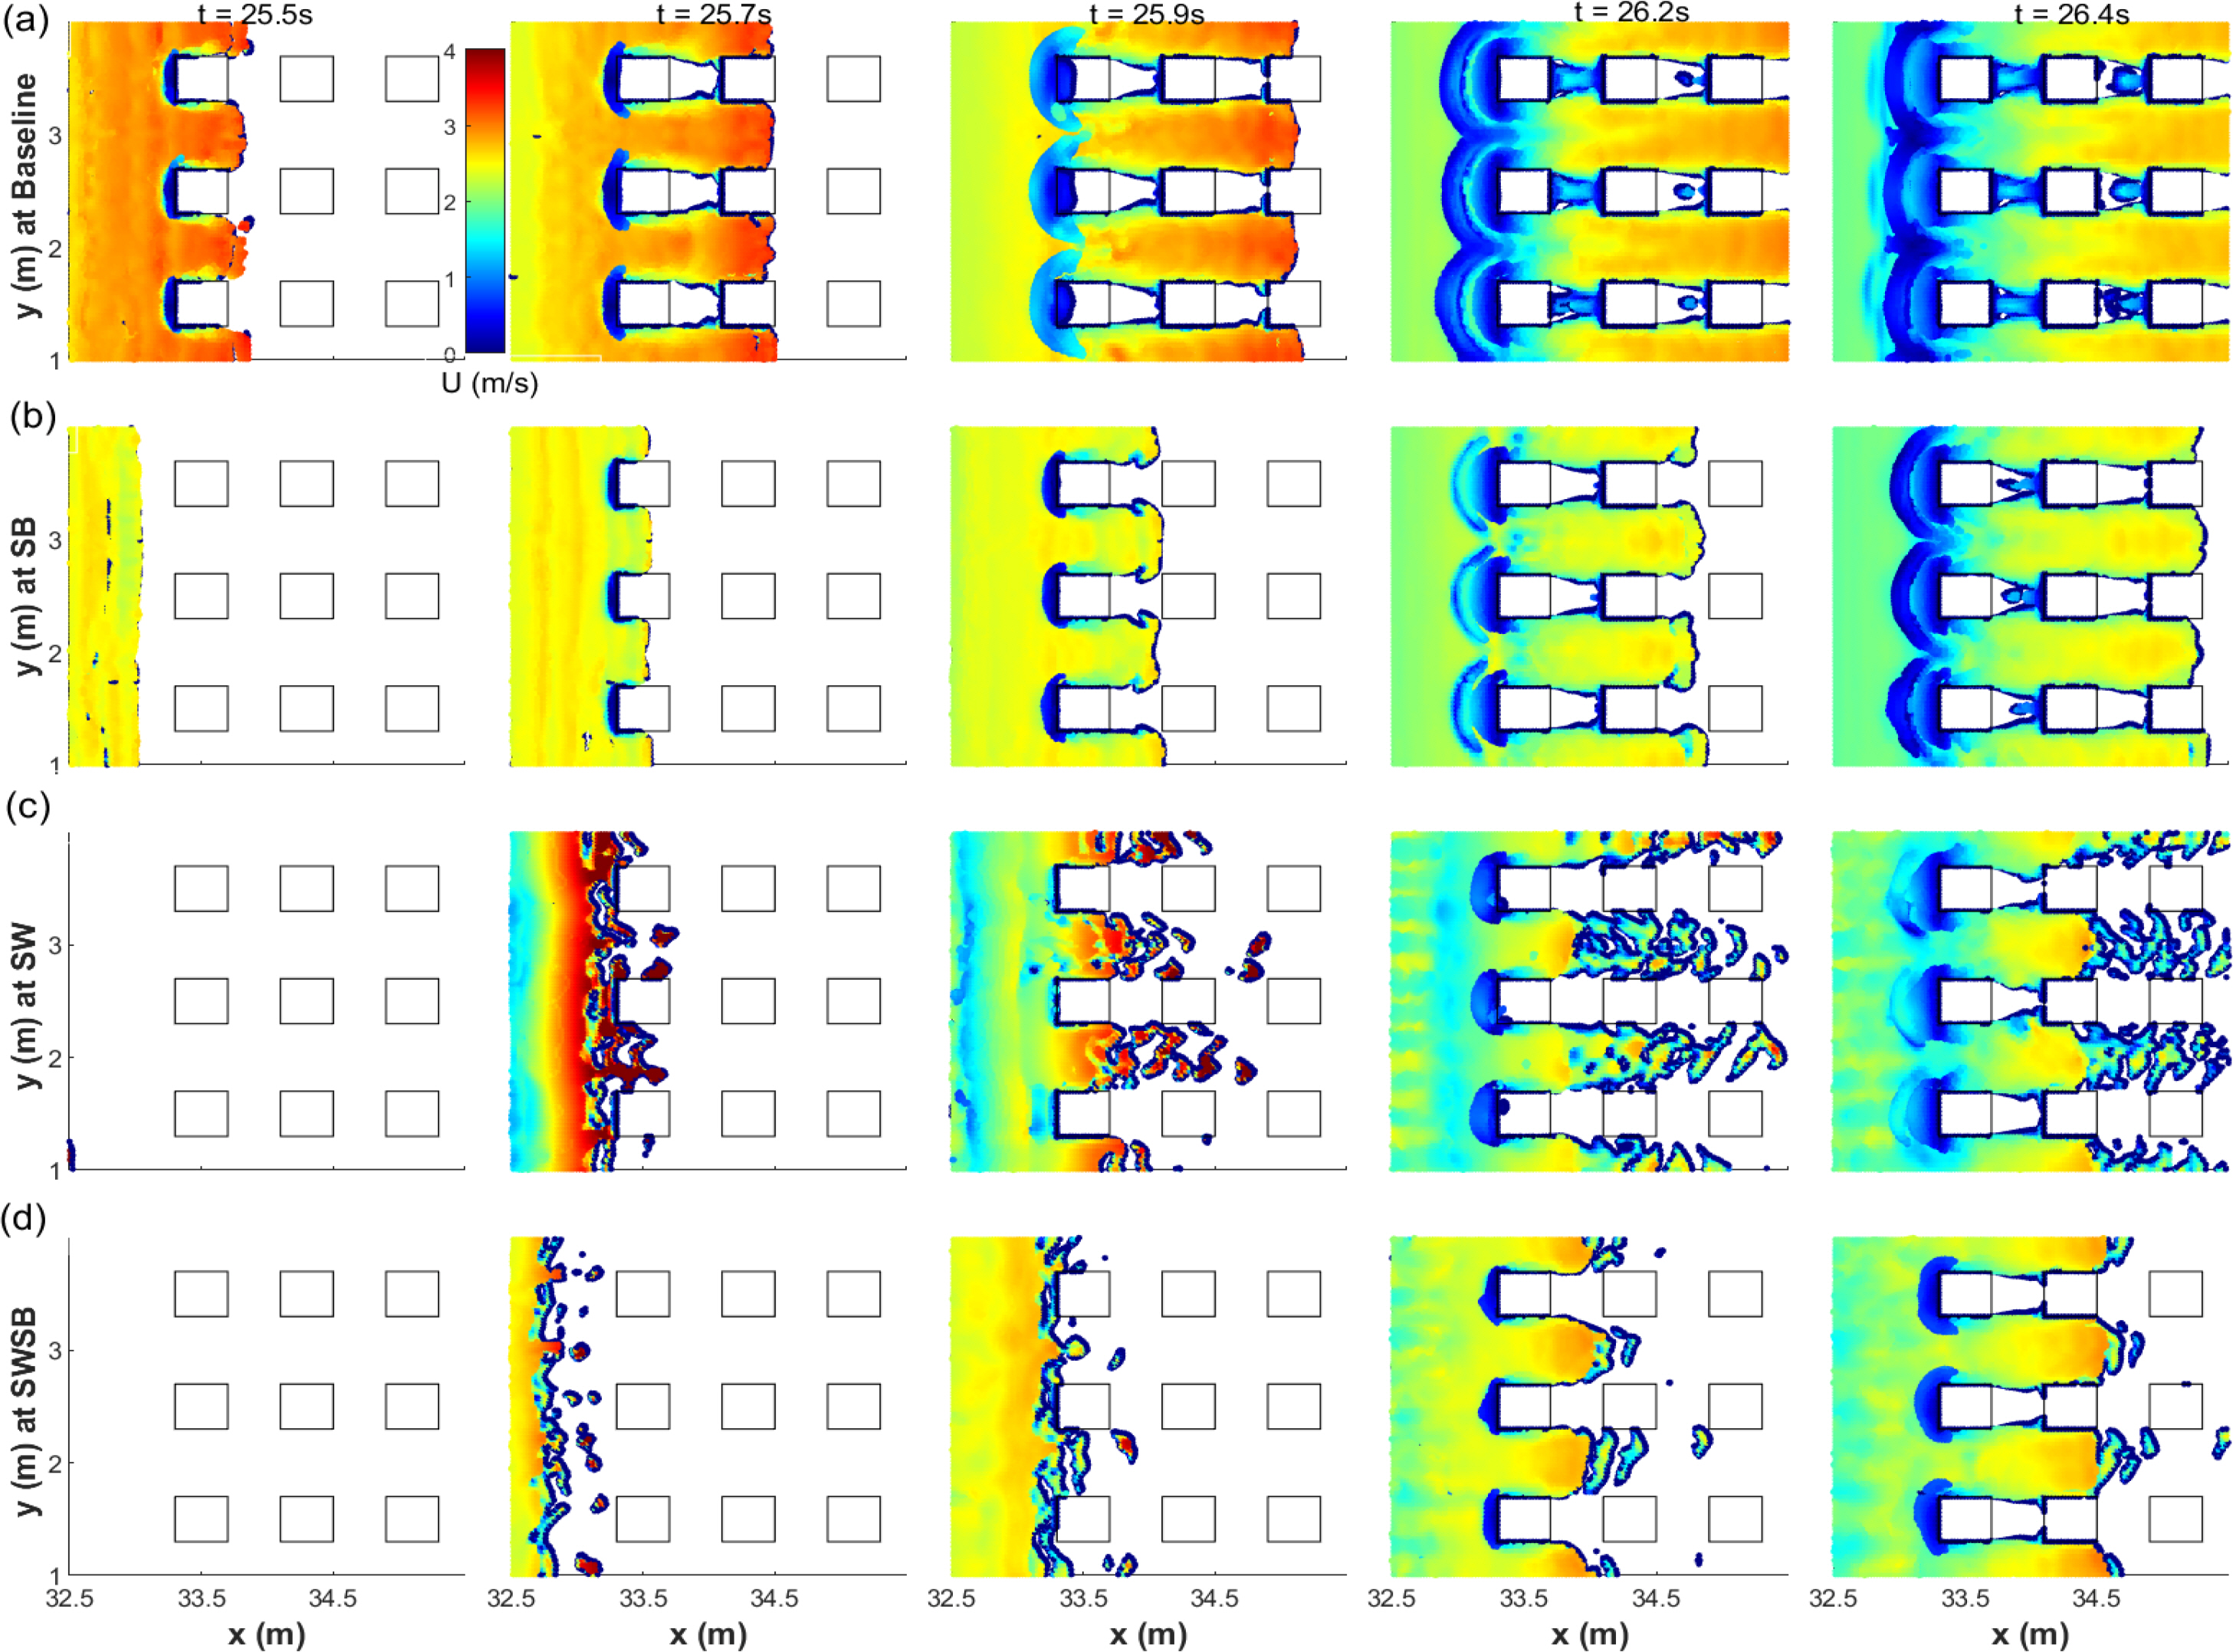
  1. In general, installing a submerged breakwater and seawall can greatly reduce the intensity of tsunami-like wave-induced overland flow impacts on coastal communities. While the baseline and SB configurations generated relatively symmetric flow propagating in the constructed environment, SW induced a large turbulent wave splash with high velocities in the built environment. Combined structural configurations significantly reduced cross-shore velocities, inundation depths, and maximum horizontal forces on the inland buildings.

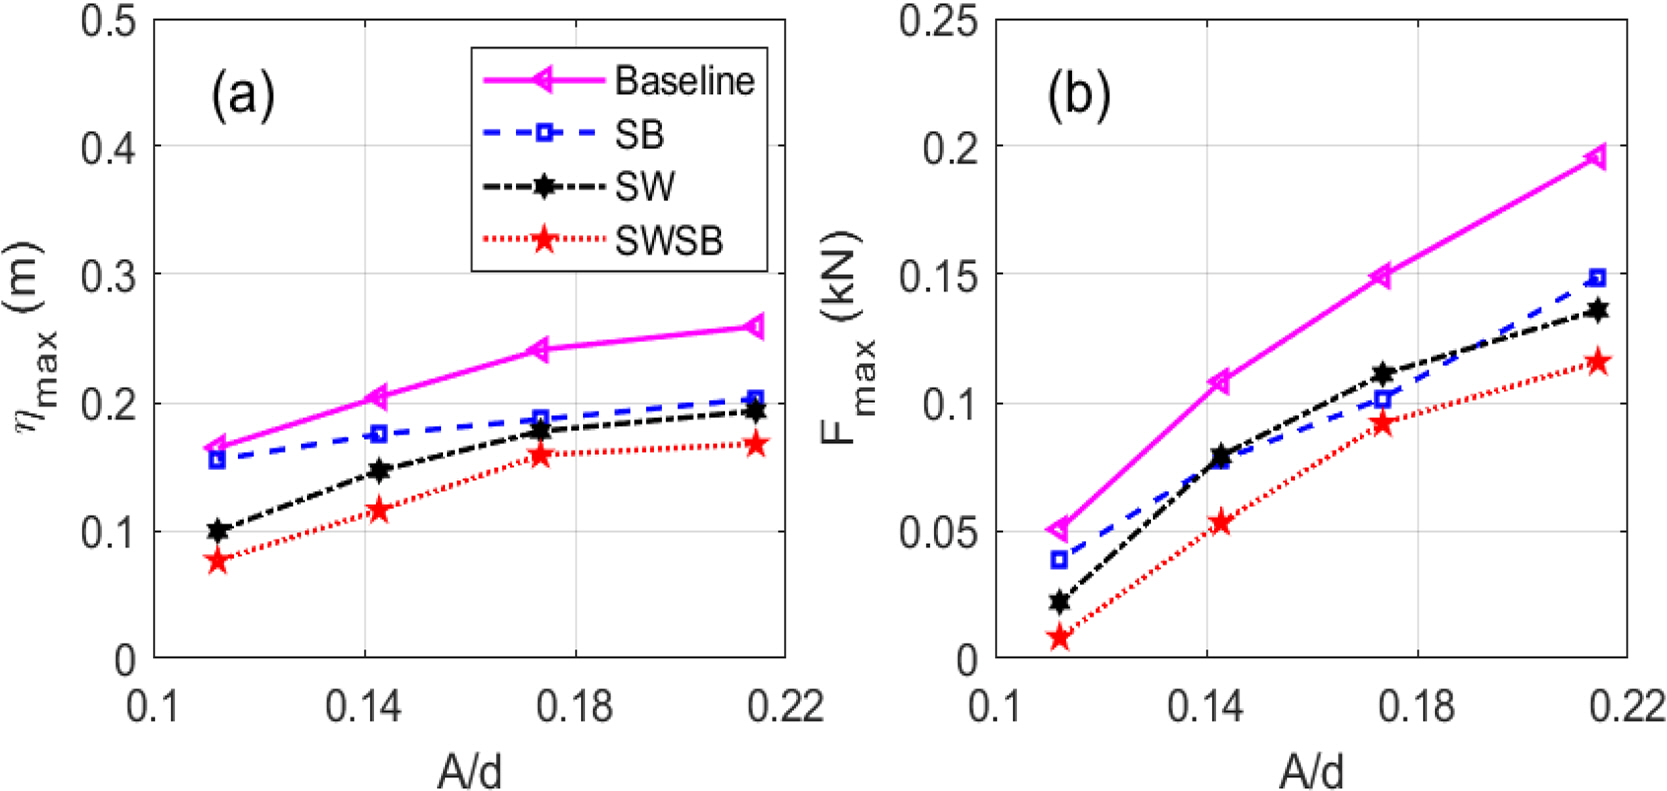
  2. The maximum flow depth and horizontal force linearly increased with the amplitude of incident waves. The presence of both a seawall and submerged breakwater significantly reduced flow depths and forces by a maximum of 64% and 84% relative to the baseline in the four wave conditions, respectively.

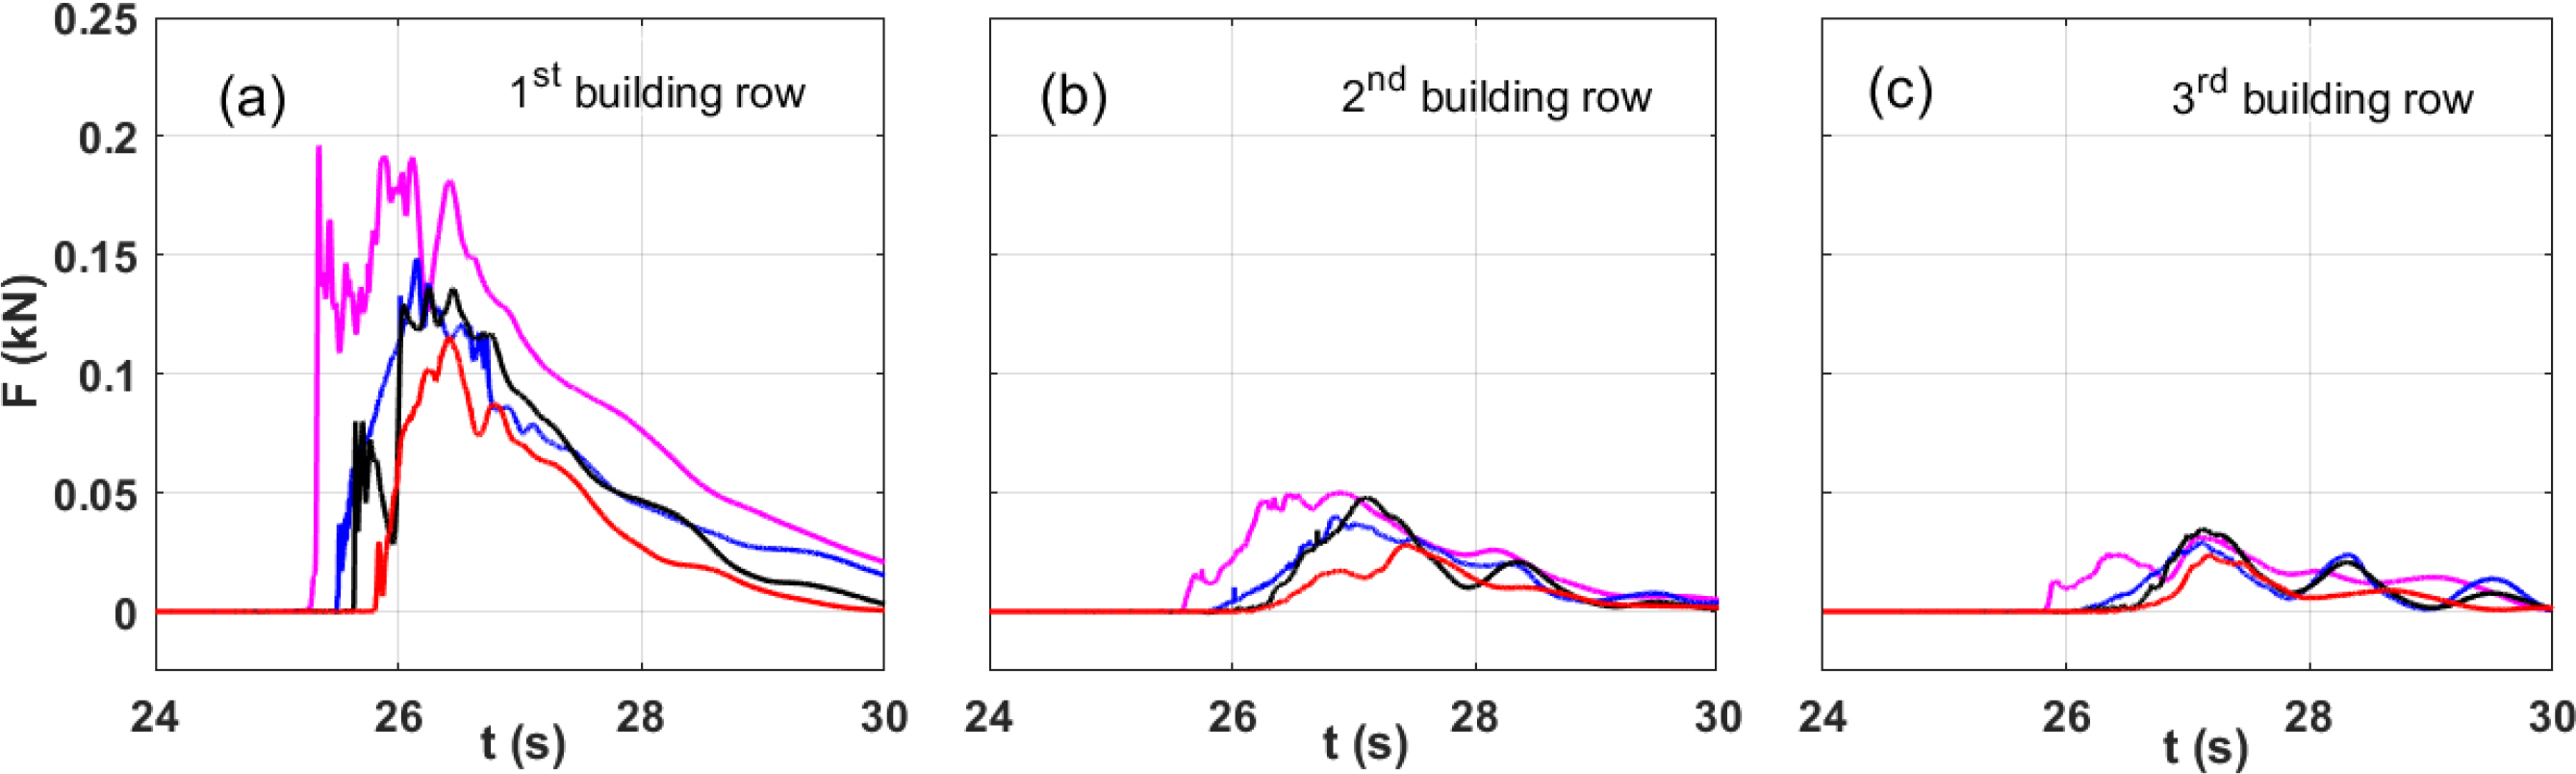
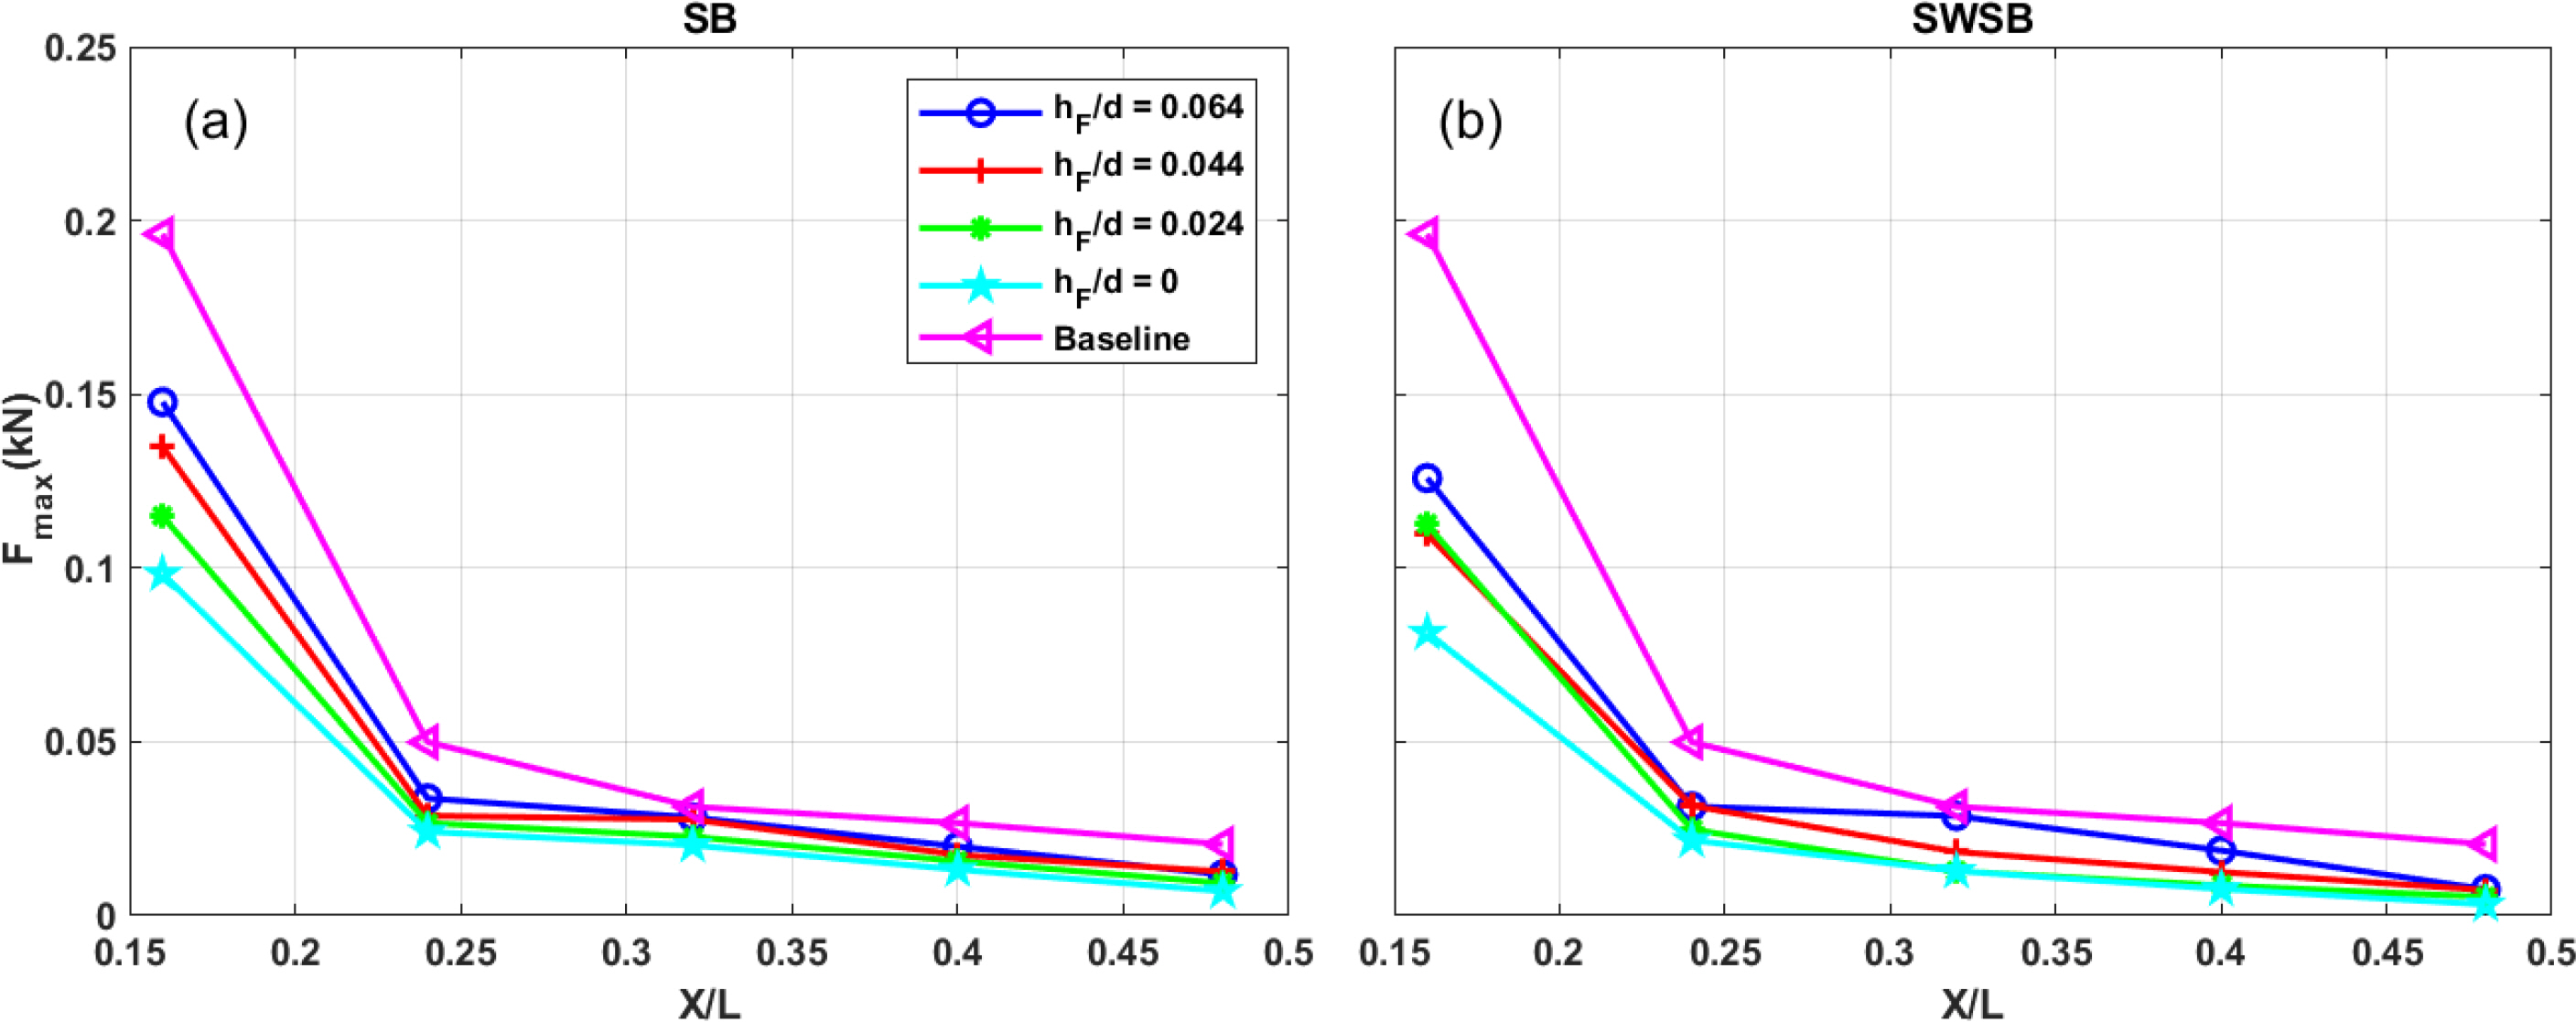
  3. The maximum force dramatically decreased with increasing seawall height. The maximum force reductions ranged from 15% to 45% for the SW configuration at different heights in the first building row, but with the additional of a submerged breakwater (SWSB), the rate of maximum force reduction only increased by 20% compared to the SW configuration.

  4. A low-lying seawall located closer to the first building row induced larger wave overtopping that directly impacted the front face of the first building rows, amplifying the maximum force by up to 25% for the seawall position of Lw/Lsh = 0.6 compared to the seawall at the shoreline at Lw/Lsh = 0.

  5. Effects of crest widths of submerged breakwaters on reducing maximum forces were very limited. The SB-only and SWSB configurations resulted in reductions of 25% and 38% of maximum baseline forces in the first building array, respectively.

  6. The freeboard of submerged breakwaters greatly influenced hydrodynamics and maximum forces in the constructed environment. Lower freeboard significantly dissipated tsunami-like wave energies, generating lower turbulent bore impacts on vertical buildings. A submerged breakwater with its crest at the still water level can reduce baseline forces by 50% and 70% for the SB-only and SWSB configurations.

This study comprehensively analyzed the hydrodynamic and force mitigation in an idealized constructed community, which was protected by seawalls and submerged breakwaters with varied dimensions and locations, but there is room for improvement. For example, this study only investigated single tsunami-like wave conditions. However, further investigation is required to consider various wave conditions in random and regular wave conditions with and without currents.

Conflict of Interest

Sungwon Shin serves as an editor of the Journal of Ocean Engineering and Technology but does not decide about the publication of this article. No potential conflicts of interest relevant to this study are reported.

Funding

This study was supported by the National Research Foundation of Korea (grant number: 2022R1F1A1071641) and the Korea Evaluation Institute of Industrial Technology (KEIT) grant, which is funded by the Korean government (KCG, MOIS, NFA) [RS-2022-001549812, Development of technology to respond to marine fires and chemical accidents using wearable devices].

Fig. 1.
Schematic of the overland flow experiment: (a) plan view illustrating the combined structural configuration and instrumentation, including wave gauges (WGs - cyan pentagram), ultrasonic wave gauges (USWGs - magenta pentagrams), acoustic doppler velocimeters (ADVs - black circle), inline loadcells (LCs - gray squares), six-degree-of-freedom loadcell (6DOF - blue square), pressure gauges (PGs - orange squares); (b) elevated view for a water level (d) of 0.98 m (figure not to scale).
ksoe-2022-036f1.jpg
Fig. 2.
Cross-shore and top views of fine mesh condition set up (G3).
ksoe-2022-036f2.jpg
Fig. 3.
Time series of hydrodynamic parameters, including offshore water surface elevations, inland flow depths, cross-shore velocities and pressures between experimental and numerical data in three mesh conditions (coarse, medium, and fine grid sizes).
ksoe-2022-036f3.jpg
Fig. 4.
Time series of horizontal forces measured in five loadcells installed in the five most seaward building rows and their maximum forces as a function of relative distance X/L.
ksoe-2022-036f4.jpg
Fig. 5.
Instantaneous simulated surface velocity at time instants t = 25.5 s, 25.7 s, 25.9 s, 26.2 s, and 26.4 s for (a) Baseline condition; (b) Submerged breakwater; (c) Seawall; (d) Combined seawall and submerged breakwater configuration.
ksoe-2022-036f5.jpg
Fig. 6.
Comparisons of time series of forces on the three most seaward building rows for structural configurations and baseline condition.
ksoe-2022-036f6.jpg
Fig. 7.
Variations of maximum flow depth (a) and horizontal forces (b) measured at the first building row for the four configurations
ksoe-2022-036f7.jpg
Fig. 8.
Velocity contours at different seawall heights at varied time instants in SW configurations: hw/A = 0.6 (left panels) and hw/A = 1.0 (right panels).
ksoe-2022-036f8.jpg
Fig. 9.
Velocity contours at different seawall heights at varied time instants in SWSB configurations: hw/A = 0.6 (left panels) and hw/A = 1.0 (right panels).
ksoe-2022-036f9.jpg
Fig. 10.
Maximum forces in five building rows at different seawall heights for SW (a) and SWSB (b) configurations.
ksoe-2022-036f10.jpg
Fig. 11.
Velocity contours at different seawall locations at varied time instants in SW configurations: Lw/Lsh = 0 (left panels) and Lw/Lsh = 0.6 (right panels).
ksoe-2022-036f11.jpg
Fig. 12.
Velocity contours at different seawall locations at varied time instants in SWSB configurations: Lw/Lsh = 0 (left panels) and Lw/Lsh = 0.6 (right panels).
ksoe-2022-036f12.jpg
Fig. 13.
Maximum forces in five building rows at different seawall locations for SW (a) and SWSB (b) configurations.
ksoe-2022-036f13.jpg
Fig. 14.
Velocity contours at different submerged breakwater freeboards at varied time instants in SB: hF/d = 0.064 (left panels) and hF/d = 0 (right panels).
ksoe-2022-036f14.jpg
Fig. 15.
Velocity contours at submerged breakwater freeboards at varied time instants in SWSB: hF/d = 0.064 (left panels) and hF/d = 0 (right panels).
ksoe-2022-036f15.jpg
Fig. 16.
Maximum forces in five building rows at different freeboards of the submerged breakwater for SW (a) and SWSB (b) configurations.
ksoe-2022-036f16.jpg
Fig. 17.
Velocity contours at different crest widths of submerged breakwater at time instants in SB: Wb/h0 = 2.7 (left panels) and Wb/h0 = 4.0 (right panels).
ksoe-2022-036f17.jpg
Fig. 18.
Velocity contours at different crest widths of submerged breakwater at time instants in SWSB: Wb/h0 = 2.7 (left panels) and Wb/h0 = 4.0 (right panels).
ksoe-2022-036f18.jpg
Fig. 19.
Maximum forces in five building rows at different crest widths of the submerged breakwater for SW (a) and SWSB (b) configurations.
ksoe-2022-036f19.jpg
Table 1.
Water depth and wave conditions
Wave cases Water depth d (m) Scale factor Sf (s) Wave amplitude A (m) Relative amplitude A/d
1 0.98 2.0 0.21 0.213
2 0.98 2.5 0.17 0.174
3 0.98 3.0 0.14 0.143
4 0.98 4.0 0.11 0.112

References

Aarup, T., Aliaga, B., Elliot, T., Kodijat, A., & Yamamoto, M. (2012). Summary Statement from the Japan – UNESCO – UNU Symposium on The Great East Japan Tsunami on 11 March 2011 and Tsunami Warning Systems: Policy erspectives 16 – 17 February 2012. UNESCO/IOC: Paris. https://www.vliz.be/en/imis?refid216585

Aghababaei, M., Koliou, M., & Paal, S. G. (2018). Performance assessment of building infrastructure impacted by the 2017 Hurricane Harvey in the Port Aransas region. Journal of Performance of Constructed Facilities, 32(5), 4018069. https://doi.org/10.1061/(ASCE)CF.1943-5509.0001215
crossref
Dang, H.V., Park, J.-N., Ha, T., Park, H., Shin, S., & Cox, D. (2022). Numerical investigation of countermeasure effects on tsunami inundation hydrodynamic and force mitigation in the coastal communities. Proceedings of 2022 spring symposium of the Korea Association of Ocean Science and Technology Societies.

Dang, V. H., Park, H., Lee, D., Shin, S., Lee, E., Cox, D., & Lomonaco, P. (2022). Physical modeling of hard structure effects on tsunami force reduction in urban coastal environment. In Ports 2022, 417-427. https://doi.org/10.1061/9780784484395.042
crossref
Eamon, C. D., Fitzpatrick, P., & Truax, D. D. (2007). Observations of structural damage caused by hurricane Katrina on the Mississippi Gulf coast. Journal of Performance of Constructed Facilities, 21(2), 117-127. https://doi.org/10.1061/(ASCE)0887-3828(2007)21:2(117)
crossref
Higuera, P., Losada, I., & Lara, J.L. (2015). Three-dimensional numerical wave generation with moving boundaries. Coastal Engineering, 101, 35-47. https://doi.org/10.1016/j.coastaleng.2015.04.003
crossref
Ishii, H., Takabatake, T., Esteban, M., Stolle, J., & Shibayama, T. (2021). Experimental and numerical investigation on tsunami run-up flow around coastal buildings. Coastal Engineering Journal, 63(4), 485-503. https://doi.org/10.1080/21664250.2021.1949920
crossref
Kihara, N., Arikawa, T., Asai, T., Hasebe, M., Ikeya, T., Inoue, S., Kaida, H., & … Watanabe, M. (2021). A physical model of tsunami inundation and wave pressures for an idealized coastal industrial site. Coastal Engineering, 169, 103970. https://doi.org/10.1016/j.coastaleng.2021.103970
crossref
Lee, H- J., & Shin, M- S. (2011). Study of wave absorbing effect of submerged breakwater. Journal of Ocean Engineering and Technology, 25(6), 29-34. https://doi.org/10.5574/KSOE.2011.25.6.029
crossref
Li, X., & Zhang, W. (2019). 3D numerical simulation of wave transmission for low–crested and submerged breakwaters. Coastal Engineering, 152, 103517. https://doi.org/10.1016/j.coastaleng.2019.103517
crossref
Lukkunaprasit, P., & Ruangrassamee, A. (2008). Building damage in Thailand in the 2004 Indian Ocean tsunami and clues for tsunami–resistant design. The IES Journal Part A: Civil & Structural Engineering, 1(1), 17-30. https://doi.org/10.1080/19373260701620162
crossref
Moris, J. P., Kennedy, A. B., & Westerink, J. J. (2021). Tsunami wave run-up load reduction inside a building array. Coastal Engineering, 169, 103910. https://doi.org/10.1016/j.coastaleng.2021.103910
crossref
Oshnack, M. E., Aguíñiga, F., Cox, D., Gupta, R., & Van de Lindt, J. (2009). Effectiveness of small onshore seawall in reducing forces induced by Tsunami bore: large scale experimental study. Journal of Disaster Research, 4(6), 382-390. https://doi.org/10.20965/jdr.2009.p0382
crossref
Park, H., Cox, D. T., Lynett, P. J., Wiebe, D. M., & Shin, S. (2013). Tsunami inundation modeling in constructed environments: A physical and numerical comparison of free–surface elevation, velocity, and momentum flux. Coastal Engineering, 79, 9-21. https://doi.org/10.1016/j.coastaleng.2013.04.002
crossref
Park, S., Song, S., Wang, H., Joung, T., & Shin, Y. (2017). Parametric study on scouring around suction bucket foundation. Journal of Ocean Engineering and Technology, 31(4), 281-287. https://doi.org/10.26748/KSOE.2017.08.31.4.281
crossref
Qin, X., Motley, M. R., & Marafi, N. A. (2018). Three-dimensional modeling of tsunami forces on coastal communities. Coastal Engineering, 140, 43-59. https://doi.org/10.1016/j.coastaleng.2018.06.008
crossref
Raby, A., Macabuag, J., Pomonis, A., Wilkinson, S., & Rossetto, T. (2015). Implications of the 2011 Great East Japan Tsunami on sea defence design. International Journal of Disaster Risk Reduction, 14, 332-346. https://doi.org/10.1016/j.ijdrr.2015.08.009
crossref
Rahman, S., Akib, S., Khan, M., & Shirazi, S. (2014). Experimental study on tsunami risk reduction on coastal building fronted by sea wall. The Scientific World Journal, 2014, 729357. https://doi.org/10.1155/2014/729357
crossref pmid pmc
Sogut, D. V., Sogut, E., & Farhadzadeh, A. (2021). Interaction of a solitary wave with an array of macro-roughness elements in the presence of steady currents. Coastal Engineering, 164, 103829. https://doi.org/10.1016/j.coastaleng.2020.103829
crossref
Sogut, E., Sogut, D. V., & Farhadzadeh, A. (2019). Effects of building arrangement on flow and pressure fields generated by a solitary wave interacting with developed coasts. Advances in Water Resources, 134, 103450. https://doi.org/10.1016/j.advwatres.2019.103450
crossref
Sun, W., Qu, K., Kraatz, S., Deng, B., & Jiang, C. (2020). Numerical investigation on performance of submerged porous breakwater to mitigate hydrodynamic loads of coastal bridge deck under solitary wave. Ocean Engineering, 213, 107660. https://doi.org/10.1016/j.oceaneng.2020.107660
crossref
Sweet, W. V., Kopp, R. E., Weaver, C. P., Obeysekera, J., Horton, R. M., Theiler, E. R., & Zervas, C. (2017). Global and Regional Sea Level Rise Scenarios for the United States (NOAA Technical Report NOS CO-OPS 083). National Oceanic and Atmospheric Administration / National Ocean Service: https://pubs.giss.nasagov/abs/sw01000b.html

Thomas, S., & Cox, D. (2012). Influence of finite–length seawalls for tsunami loading on coastal structures. Journal of Waterway, Port, Coastal, and Ocean Engineering, 138(3), 203-214. https://doi.org/10.1061/(ASCE)WW.1943-5460.0000125
crossref
TOOLS
Share :
Facebook Twitter Linked In Google+ Line it
METRICS Graph View
  • 1 Crossref
  •   Scopus
  • 1,467 View
  • 72 Download


ABOUT
BROWSE ARTICLES
ARTICLE CATEGORY

Browse all articles >

PUBLICATION ETHICS
FOR CONTRIBUTORS
Editorial Office
President Office BD Rm. 1302, 13 Jungang-daero 180beon-gil, Dong-gu, Busan 48821, Republic of Korea
Tel: +82-51-759-0656    Fax: +82-51-759-0656    E-mail: ksoehj@ksoe.or.kr                

Copyright © 2024 by The Korean Society of Ocean Engineers.

Developed in M2PI

Close layer
prev next