
1. Introduction
Submerged breakwaters (SBWs) are coastal structures commonly used to block high waves, i.e., the main external force of coastal erosion, and maintain coastal landscapes. In South Korea, several SBWs have been installed to respond to increased frequency of high waves caused by storms and erosion caused by artificial development. However, SBWs, change the wave energy environment on the coast and cause an increase in water level and changes in wave-induced currents in the hinterland of SBWs, thereby significantly affecting sediment transport in nearby waters and coastline changes (Ranasinghe et al., 2010; Villani et al., 2012). In particular, wave breaking occurs around SBWs, making their prediction one of the challenges in the field of coastal engineering. Such wave breaking causes unexpected erosion in 60% of the coastal areas with SBWs (Ranasinghe and Turner, 2006) and occurs frequently on the east coast of Korea. Thus, to minimize the side effects of installing SBWs, understanding the coastal physical environment after their installation is essential. In this regard, various studies have been conducted through field observation and hydraulic model experiments. In particular, several studies on the transmission rate of the waves generated in the open sea to the hinterland caused by SBWs have been conducted in two-dimensional (2D) hydraulic model water tanks (Lorenzoni et al., 2012; Marin and Savov, 2017; Walmsley et al., 2002), but the flow in the coastal direction and the diffraction of waves caused by SBWs cannot be considered. Haller et al. (2002) explained that the flow generated between SBWs dominates the flow pattern in the hinterland of SBWs and near the coastline through a three-dimensional (3D) hydraulic model experiment. Ranasinghe et al. (2010) and Ranasinghe et al. (2006) analyzed the experiment results of previous studies (Dean et al., 199; Groenewoud et al., 1996; Nobuoka et al., 1996) and presented the pattern of the circulation flow (2-cell circulation, 4-cell circulation) that appears as wave breaking dissipates behind SBWs. The latter proposed that the flowŌĆÖs pattern is determined by the location and dimensions of the structure (width and crest height of SBWs) as well as incident waves from the open sea, which are major factors that cause the advance and retreat of the coastline. However, they had limitations in spatially observing complex phenomena that occur around SBWs comprehensively, with studies actively conducted worldwide on the development and advancement of numerical modeling techniques to evaluate the changes in waves, currents, and topography caused by the installation of SBWs in advance (Johnson et al., 2005; Liang et al., 2015; Magdalena et al., 2020; Quataert et al., 2020). However, previous studies reproduce the coastal flow, sediment transport, and topographic changes caused by SBWs through a 2D precision model to simulate the attenuation of the waves caused by SBWs and a planar model based on water depth integration and wave-governing equations. In this study, the simulating waves till shore (SWASH) model was used to simulate flow velocity by dividing layers in the vertical water-depth direction and accurately simulate the flow in the coastal area where the dissipation of wave-breaking is important or in front of and behind SBWs compared to planar models (Smit et al., 2013). Suzuki et al. (2011) and Liang et al. (2015) compared simulation results with water tank experiment results to examine the applicability of the SWASH model to coastal areas where artificial structures are installed. The wave transformation and overtopping caused by SBWs were well simulated; however, only the effects in the vertical direction were considered in both studies. Rathnayaka and Tajima (2020) compared flow field simulation results around SBWs with hydraulic experiment results to evaluate the reproducibility of the SWASH model for the single-layer mode and two-layer mode and concluded that complex wave changes and flows behind SBWs are better simulated in the two-layer mode. Da Silva et al. (2022) examined the influence of SBWs on coastal flow and wave runup using the SWASH model and explained that the average flow pattern that occurs on the coast could be used as a means of predicting the sediment transport pattern. In Korea, the flow characteristics of coastal wave-induced currents were analyzed using the SWASH model (Jang et al., 2014; Kang et al., 2015; lee et al., 2015); however, the analysis was conducted by applying single-layer models to the beach with no SBW.
In this study, SWASH, a quasi-3D numerical model that can simulate vertical and horizontal flows simultaneously, was used to precisely simulate wave transformation and coastal flow in the event of a typhoon (Zijlema et al., 2011). The simulation results were indirectly compared using topographic change observation data before and after a typhoon. To this end, observation data acquired from Bongpo Beach were used, with erosion and deposition patterns in Bongpo Beach analyzed through wave series dominant on the beach during typhoon and the water depth difference by section before and after a typhoon. Considering it is difficult to identify mechanisms that cause sediment transport and topographic changes using observation data alone in Bongpo Beach, where several structures, including SBWs, are installed, the coast where SBWs were installed was divided into four layers in the vertical direction, with flow simulation was performed for each layer. The analysis of the flow field and wave transformation results of the depth layer that dominantly causes topographic changes among the simulation results confirmed that the coastal flow was different depending on the incident wave conditions. Bongpo Beach was divided into sections for effective analysis, and wave conditions that dominantly cause topographic changes were proposed.
2. Target Sea Area and Observation Data
2.1 Study Area
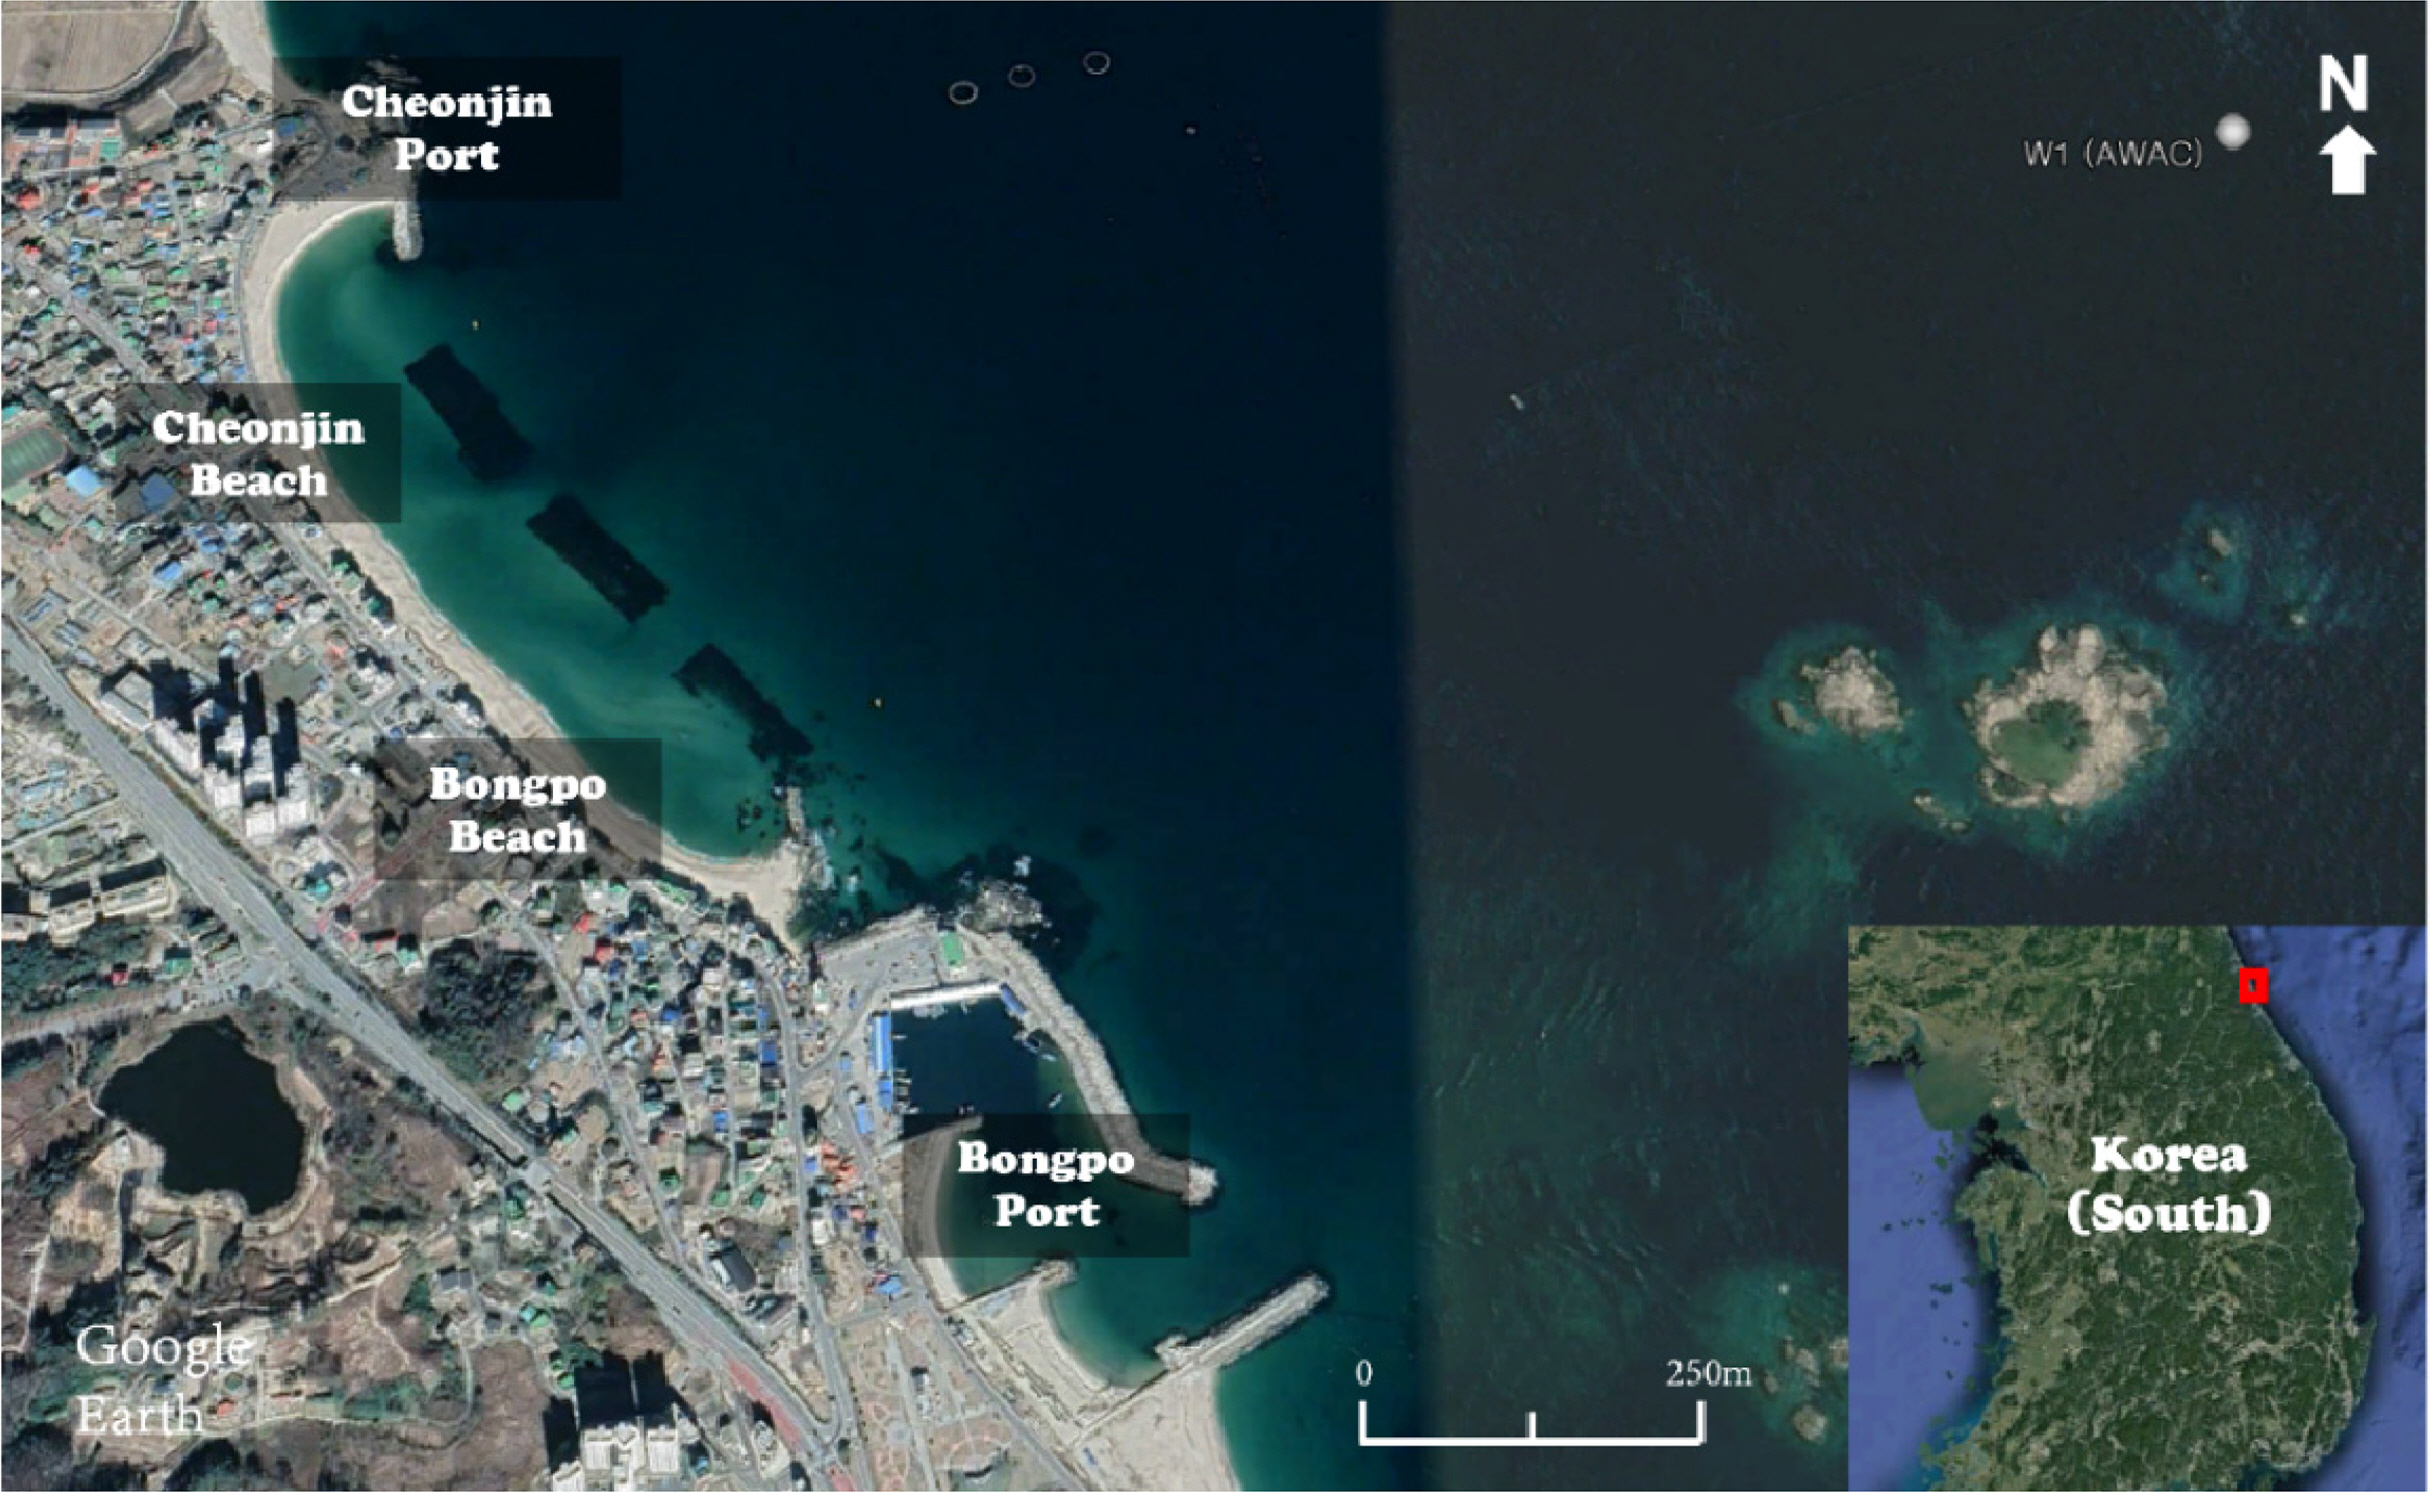
In this study, data was collected through field observation, with numerical simulation performed to investigate phenomena using the data for CheonjinŌĆōBonpo Beach, where coastal maintenance projects were performed and SBWs were installed due to continuous coastal erosion after the construction of Cheonjin Port. CheonjinŌĆōBongpo Beach is inclined by approximately 45 degrees from the north and open to the northeast in the form of a beak, with waves more dominant than tides (Fig. 1). The total coastline length is 1.15 km, with the beach mostly comprising sand. After coastal maintenance projects, the average median particle diameter (D50) was approximately 0.7 mm. The tidal range is approximately 18 cm and the influence of tidal currents is limited. The introduction of east-northeast (ENE) waves perpendicular to the coastline is dominant. The port located to the north of this beach is Cheonjin and the port to the south is Bongpo. The beaches in the middle are also divided into Cheonjin and Bongpo Beach, but they are collectively referred to as Bongpo Beach in this study. The target sea area had continuous erosion problems due to the construction of the ports and installation of revetment and was thus designated as an area subjected to erosion grade evaluation in surveys on coastal erosion since 2005. The evaluation is performed based on the monitoring grade evaluation criteria of the Ministry of Oceans and Fisheries, with four grades dependent on the evaluation results: A (excellent), B (moderate), C (concerned), and D (serious). Concerning Bongpo Beach, the extension of breakwaters in Cheonjin Port and the construction of coastal roads were analyzed as the causes of erosion. Bongpo Beach was continuously classified as grades C and D from 2010 to 2016, indicating that the sandy beach and hinterland are vulnerable to disasters. Accordingly, coastal maintenance projects, including installation of SBWs and beach nourishment, were performed every year from 2016 to 2019 as countermeasures against erosion. Consequently, three SBWs with a length of 150 m and a width of 40 m were installed on the front of the beach, located at 50 cm below sea level. The distance between them is approximately 80 m, with all of them located approximately 110 m from the coastline. The average beach width before the coastal maintenance projects was found to be approximately 35 m for Cheonjin and 28 m for Bongpo Beach. After the projects, the widths increased to approximately 44 and 35 m. Upon project completion, Cheonjin Beach was still classified as grade C, but Bongpo Beach was classified as grade A due to the change in coastal sediment caused by the SBWs in the assessment performed in 2021. However, erosion still occurs due to summer typhoons and large height swell-like waves in winter.
2.2 Wave Data During the Typhoon Period
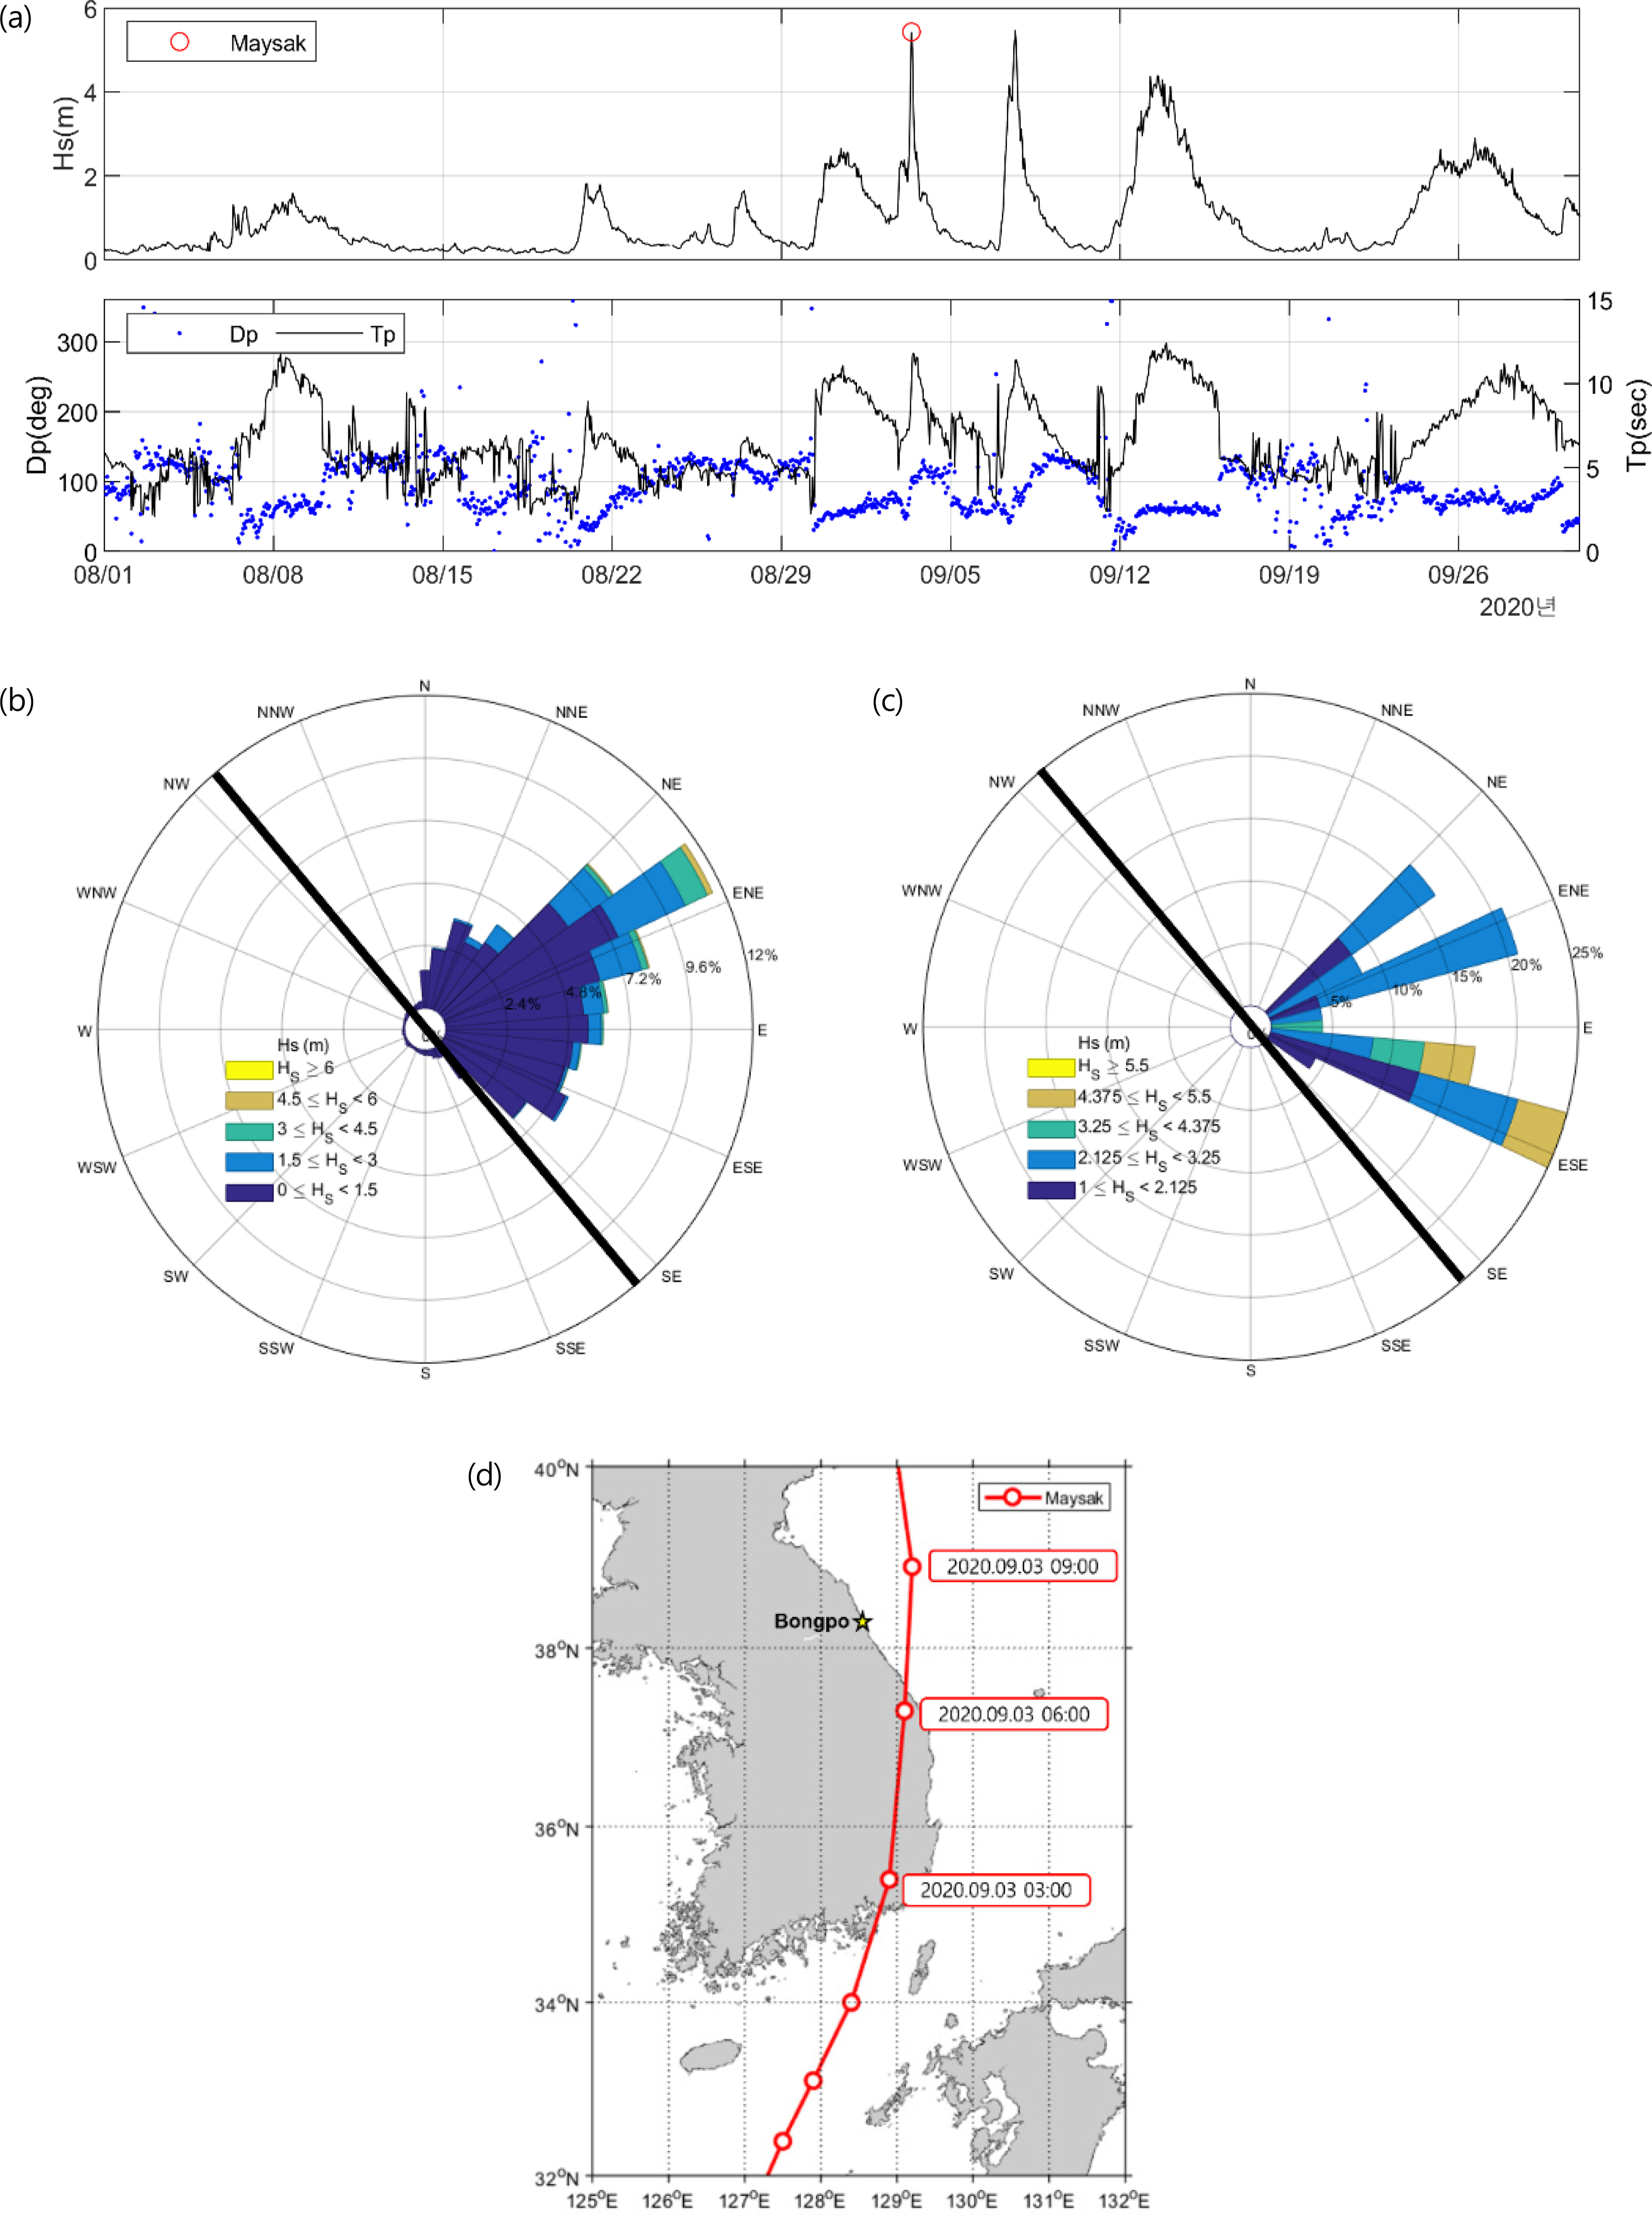
Wave observation was performed every hour from April 2020 to March 2021 by installing acoustic waves and currents (AWAC) at the mean sea level (MSL) (ŌłÆ) 25 m point (Fig. 1, W1). Fig. 2(a) shows the data from August 1 to October 1, 2020, when high waves occurred due to a typhoon in time series. When the significant wave height (Hs), peak period (Tp), peak wave direction (Dp), and wave rose during the entire observation period were analyzed, it was found that ENE waves were dominant (Fig. 2(b)). In the wave time-series data, Typhoon Maysak on September 3, 2020, which caused sand loss to the open sea and topographic changes in Bongpo Beach, is included. In this study, sediment transport and topographic change patterns in the SBW opening and hinterland by storm waves were analyzed using wave data and topographic observation data. Typhoon Maysak, with a minimum central pressure of 935 hPa and a maximum wind speed of 50ŌĆō55 m/s, caused severe damage to the coastal areas of the East Sea, South Sea, and Jeju Island. At the wave observation point installed in Bongpo Beach, a maximum significant wave height of 5.43 m was observed, with a peak period of 10.01s. When the period during which Typhoon Maysak affected Bongpo Beach was analyzed in detail, both east-southeast (ESE) and ENE waves were found to be dominant (Fig. 2(c)). ENE waves perpendicular to the coastline of Bongpo Beach, were dominant, with a high proportion of 50%. However, a relatively low significant wave height of 3 m or less was observed. In contrast, ESE waves oblique to the coastline included several significant wave heights of 3 m or higher, even though their frequency was lower (a proportion of 40%) compared to ENE waves. This wave direction distribution affected waves by varying the wind direction according to the direction of Typhoon Maysak and its center location (Fig. 2(d)); it is considered that high ESE waves caused sediment transport and topographic changes different from large height swell-like waves in winter.
2.3 Water Depth Data Before and After Storm Waves
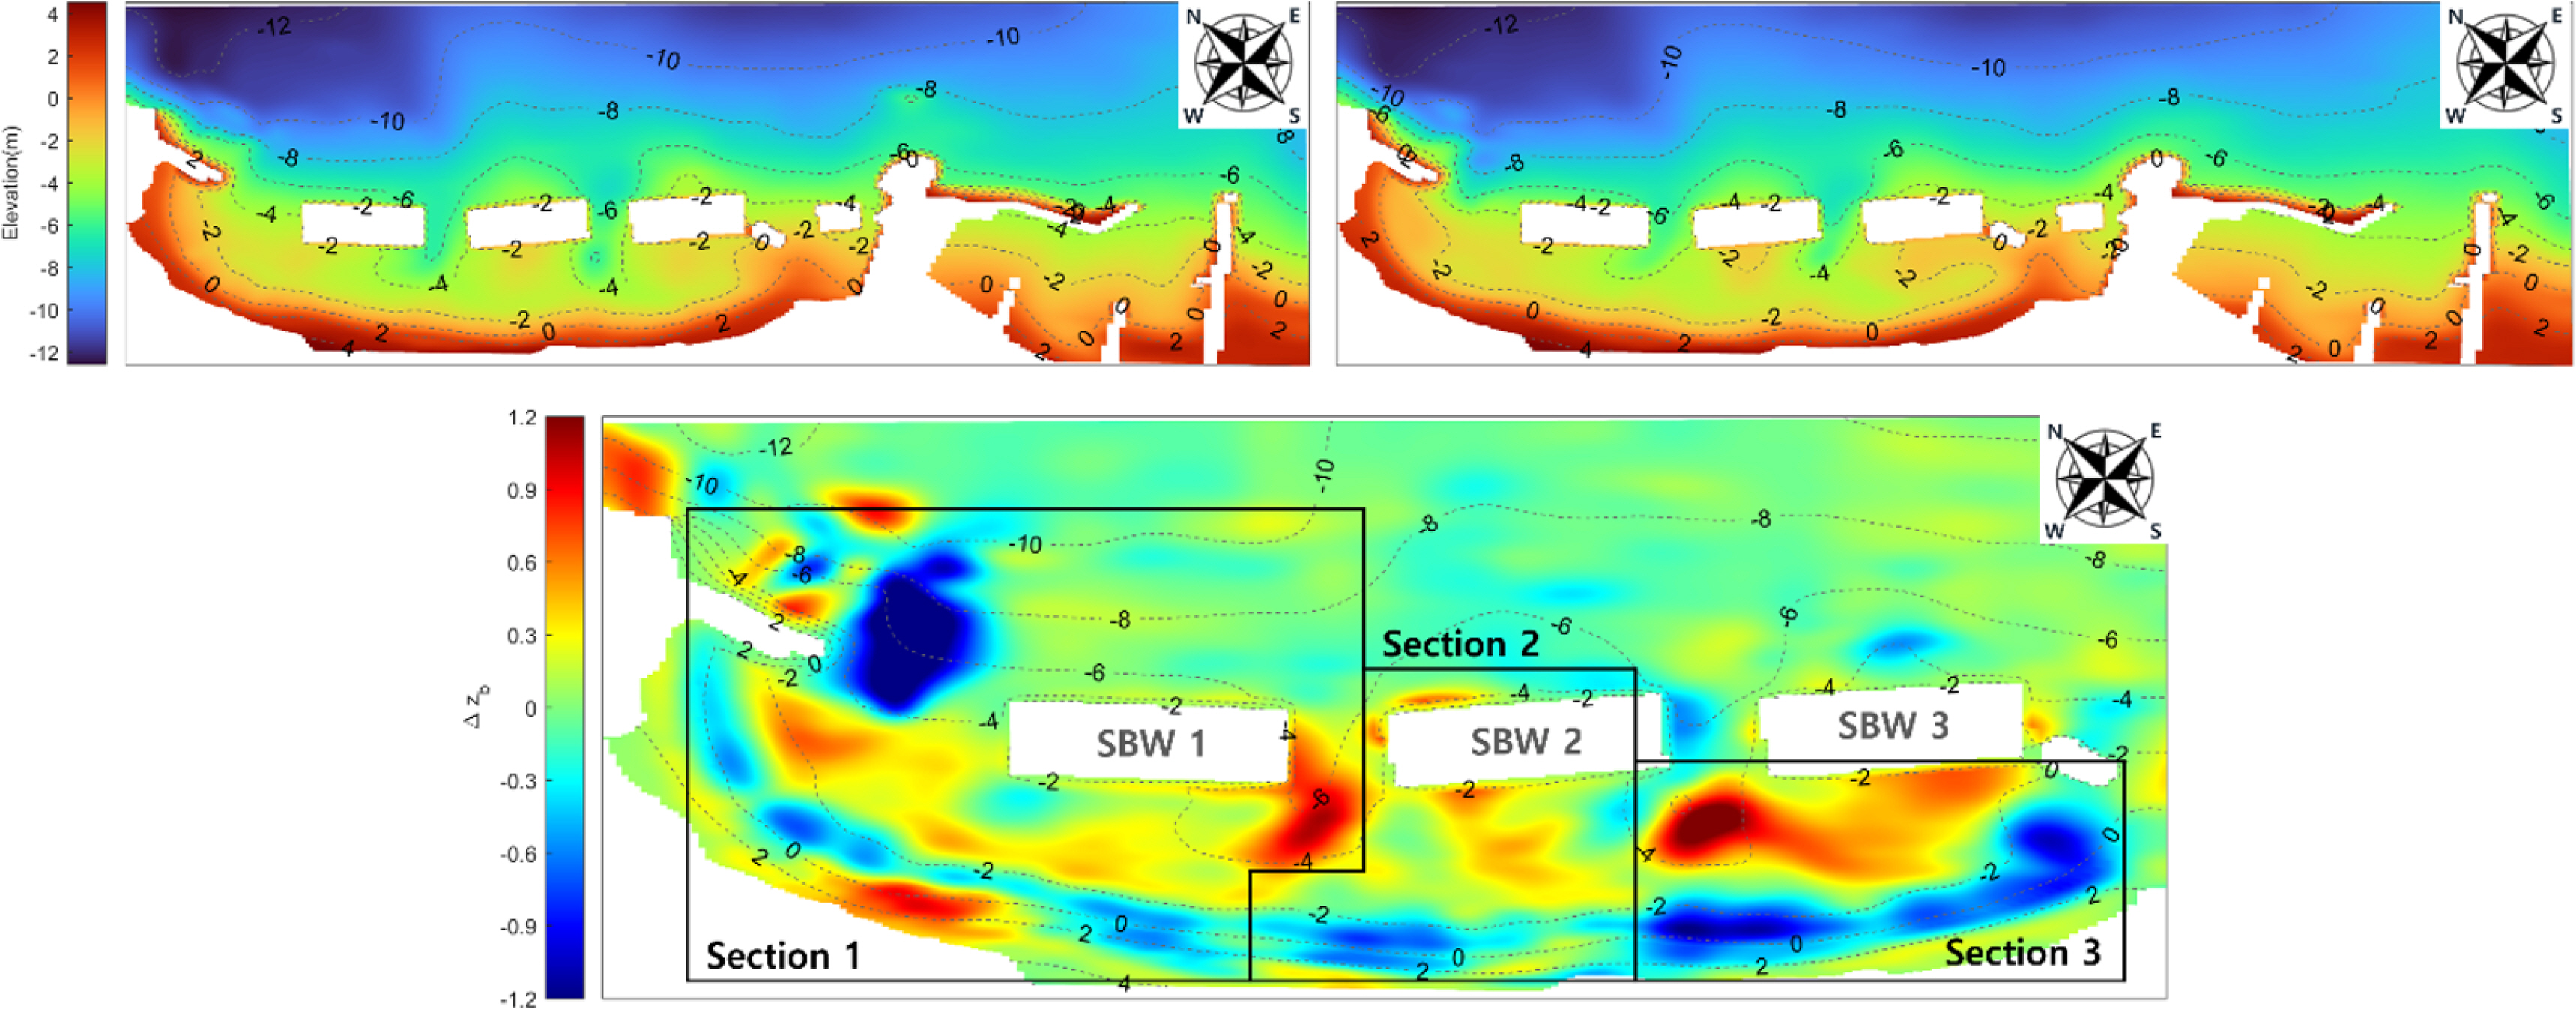
Water depth observation was performed using an echo sounder (AquaRuler 200S, SonarTech) and a high-precision global navigation satellite system (GNSS) installed in a ship from MSL (ŌłÆ) 14 m to the MSL point. In addition, for the area from MSL to MSL (+) 5 m, including the coastline, data were acquired using real-time kinematic (RTK)-GNSS while moving along the coastline on foot with transportation equipment. In the case of Bongpo Beach, as almost no topographic change occurs outside MSL (ŌłÆ) 10 m, the depth of closure is judged to be approximately MSL (ŌłÆ) 10 m (Lim et al., 2021). Six observations were performed at 5 m or 10 m intervals to analyze the topographic changes caused by storm waves and high waves from July 2020 to March 2021. Five periods were analyzed based on the water depth observation time points, as shown in Table 1, classified into three erosion (E) periods when topographic changes are expected under the influence of high significant wave heights and two stabilization periods when beach stabilization is confirmed after high wave. In this study, the water depth data of the E1 period, which showed sand loss and topographic changes due to Typhoon Maysak after beach stabilization, were analyzed. When the water depth data before (August 25, 2020) and after (September 6, 2020) the typhoon were compared, it appears that the sand eroded near the coastline was transported and deposited in the hinterland of SBWs, which ranged from MSL (ŌłÆ) 4 m to MSL (ŌłÆ) 2 m. The sand volume, calculated where the water depth difference before and after the typhoon, was significant in analyzing the transport path of the lost sand in detail. Moreover, Bongpo Beach was divided into three sections to ensure that the difference between the erosion and deposition amounts could be minimized (Fig. 3). In this instance, the difference between the erosion and accretion volumes was approximately 2,000 m3 in each section. Table 2 shows the volumes and volume differences in each section. In sections 2 and 3, the sand lost from the coastline is estimated to be deposited in the hinterland of SBWs 2 and 3. In the case of section 1, which shows complex water depth differences in many areas, there are limitations in predicting phenomena using observation data alone. Therefore, for the section, it is deemed necessary to analyze erosion and accretion patterns considering wave conditions that cause topographic changes and flow simulation results.
2.4 Flow Patterns in the Hinterland of SBWs
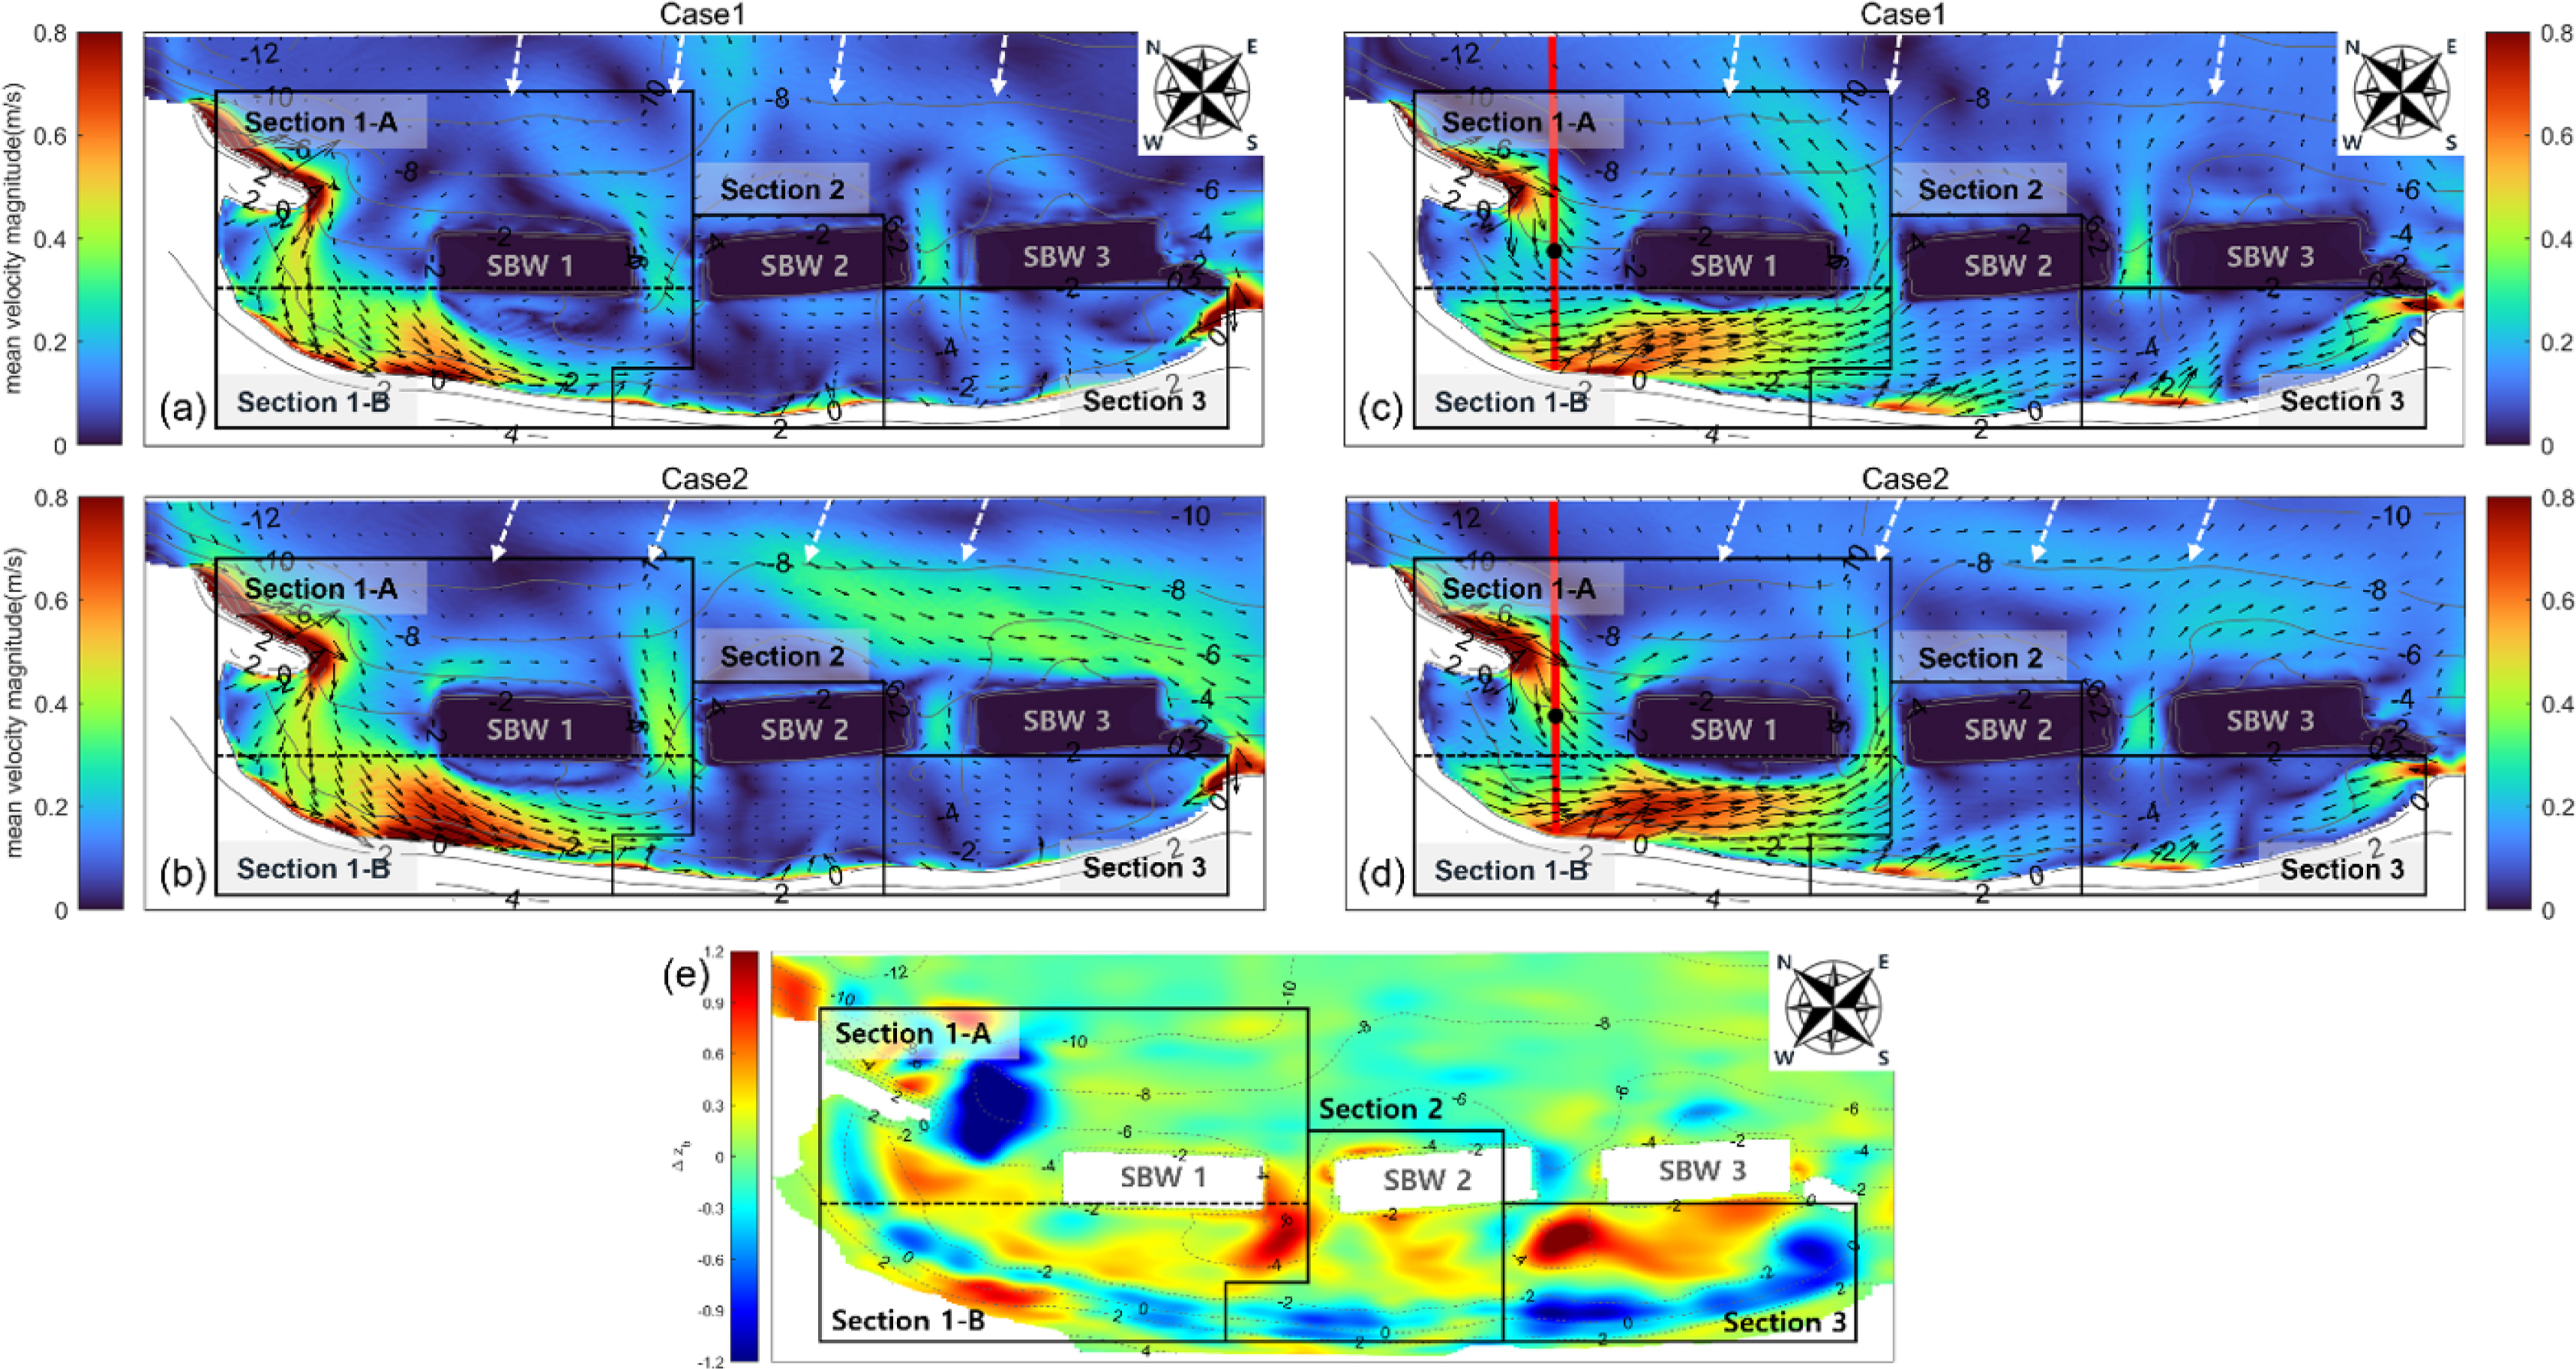
As aforementioned, the circulation flow pattern is determined by the distance between the coastline and SBWs and incident wave conditions on the coast where SBWs are installed. Fig. 4 briefly shows the patterns of coastal currents that may occur in the hinterland of SBWs, which were discussed in previous studies (Ranasinghe et al., 2010; Ranasinghe and Turner, 2006). First, when the phenomenon that waves pass through SBWs and proceed to the hinterland is dominant, the water level of the hinterland rises, making the flow from the openings of the SBWs toward the open sea dominant, thereby generating two symmetrical circulation flows (2-cell current pattern) (Fig. 4(a)). In contrast, when the energy of waves is significantly dissipated while passing over SBWs, the flow in a direction parallel to the coastline becomes dominant, with four strong symmetrical circulation flows occurring in the hinterland of the SBWs, where wave energy is relatively low (4-cell current pattern) (Fig. 4(b)). In the 2-cell pattern, the erosion of the hinterland is induced because sand is transported from the hinterland to the openings of the SBWs. As for the 4-cell pattern, the accretion of the hinterland is dominant because the sand at the openings of the SBWs is transported to the hinterland. All flows shown in Fig. 4 are circulation patterns caused by normal incident waves. Oblique incident waves cause the development of longshore currents due to the direction of waves in the hinterland, while asymmetrical circulation flows significantly affected by the direction of longshore currents occur at erosion and accretion points (Ranasinghe et al., 2006).
Analyzing the topographic observation data, it was found that erosion near the coastline was dominant for Bongpo Beach due to Typhoon Maysak. It is estimated that ENE waves, which are perpendicular to the coastline, formed the 2-cell circulation pattern in section 2 where SBW 2 was installed, thereby causing erosion from the hinterland and accretion in the opening (Fig. 3). Simultaneously, through the erosion point deflected to the northwest (NW) from the central part of the hinterland of SBW 2, it is considered that ESE waves formed asymmetrical circulation flows by developing strong NW longshore currents in the hinterland of SBW2. Notably, the Cheonjin Port breakwater generated southeast (SE) longshore currents in the hinterland of SBW 1 by causing reflected and diffracted waves in section 1, and the reflected waves by the jetty installed on the southeast side of SBW 3 generated NW longshore currents in the hinterland of SBW 3 in section 3, indicating that these two flows only strengthened the flow toward the openings of the SBWs.
3. Numerical Model Introduction and Input Data
3.1 SWASH Model
In this study, the SWASH model developed was based on the research by Smit et al. (2013), Stelling and Duinmeijer (2003), Stelling and Zijlema (2003), Zijlema and Stelling (2008), Zijlema et al. (2011), and Zijlema and Stelling (2005) and was used to identify the flow characteristics of Bongpo Beach under storm wave conditions. The SWASH model simulates hydrodynamic processes (e.g., nonlinear waves, rotational flows, and energy and sediment transport phenomena) caused by wave transformation on the coast; its governing equations are nonlinear shallow water equations that include a non-hydrostatic pressure term based on the NavierŌĆōStokes equations. The SWASH model uses the approximation of linear dispersion and simulates the flow of layers in the vertical direction by performing wave transformation calculations with improved accuracy. This model also calculates the energy dissipation caused by wave breaking and effectively reproduces the characteristics of nonlinear waves under wave-breaking conditions, making it suitable for large-scale storm wave and high wave calculations.
3.2 Grid and Model Construction
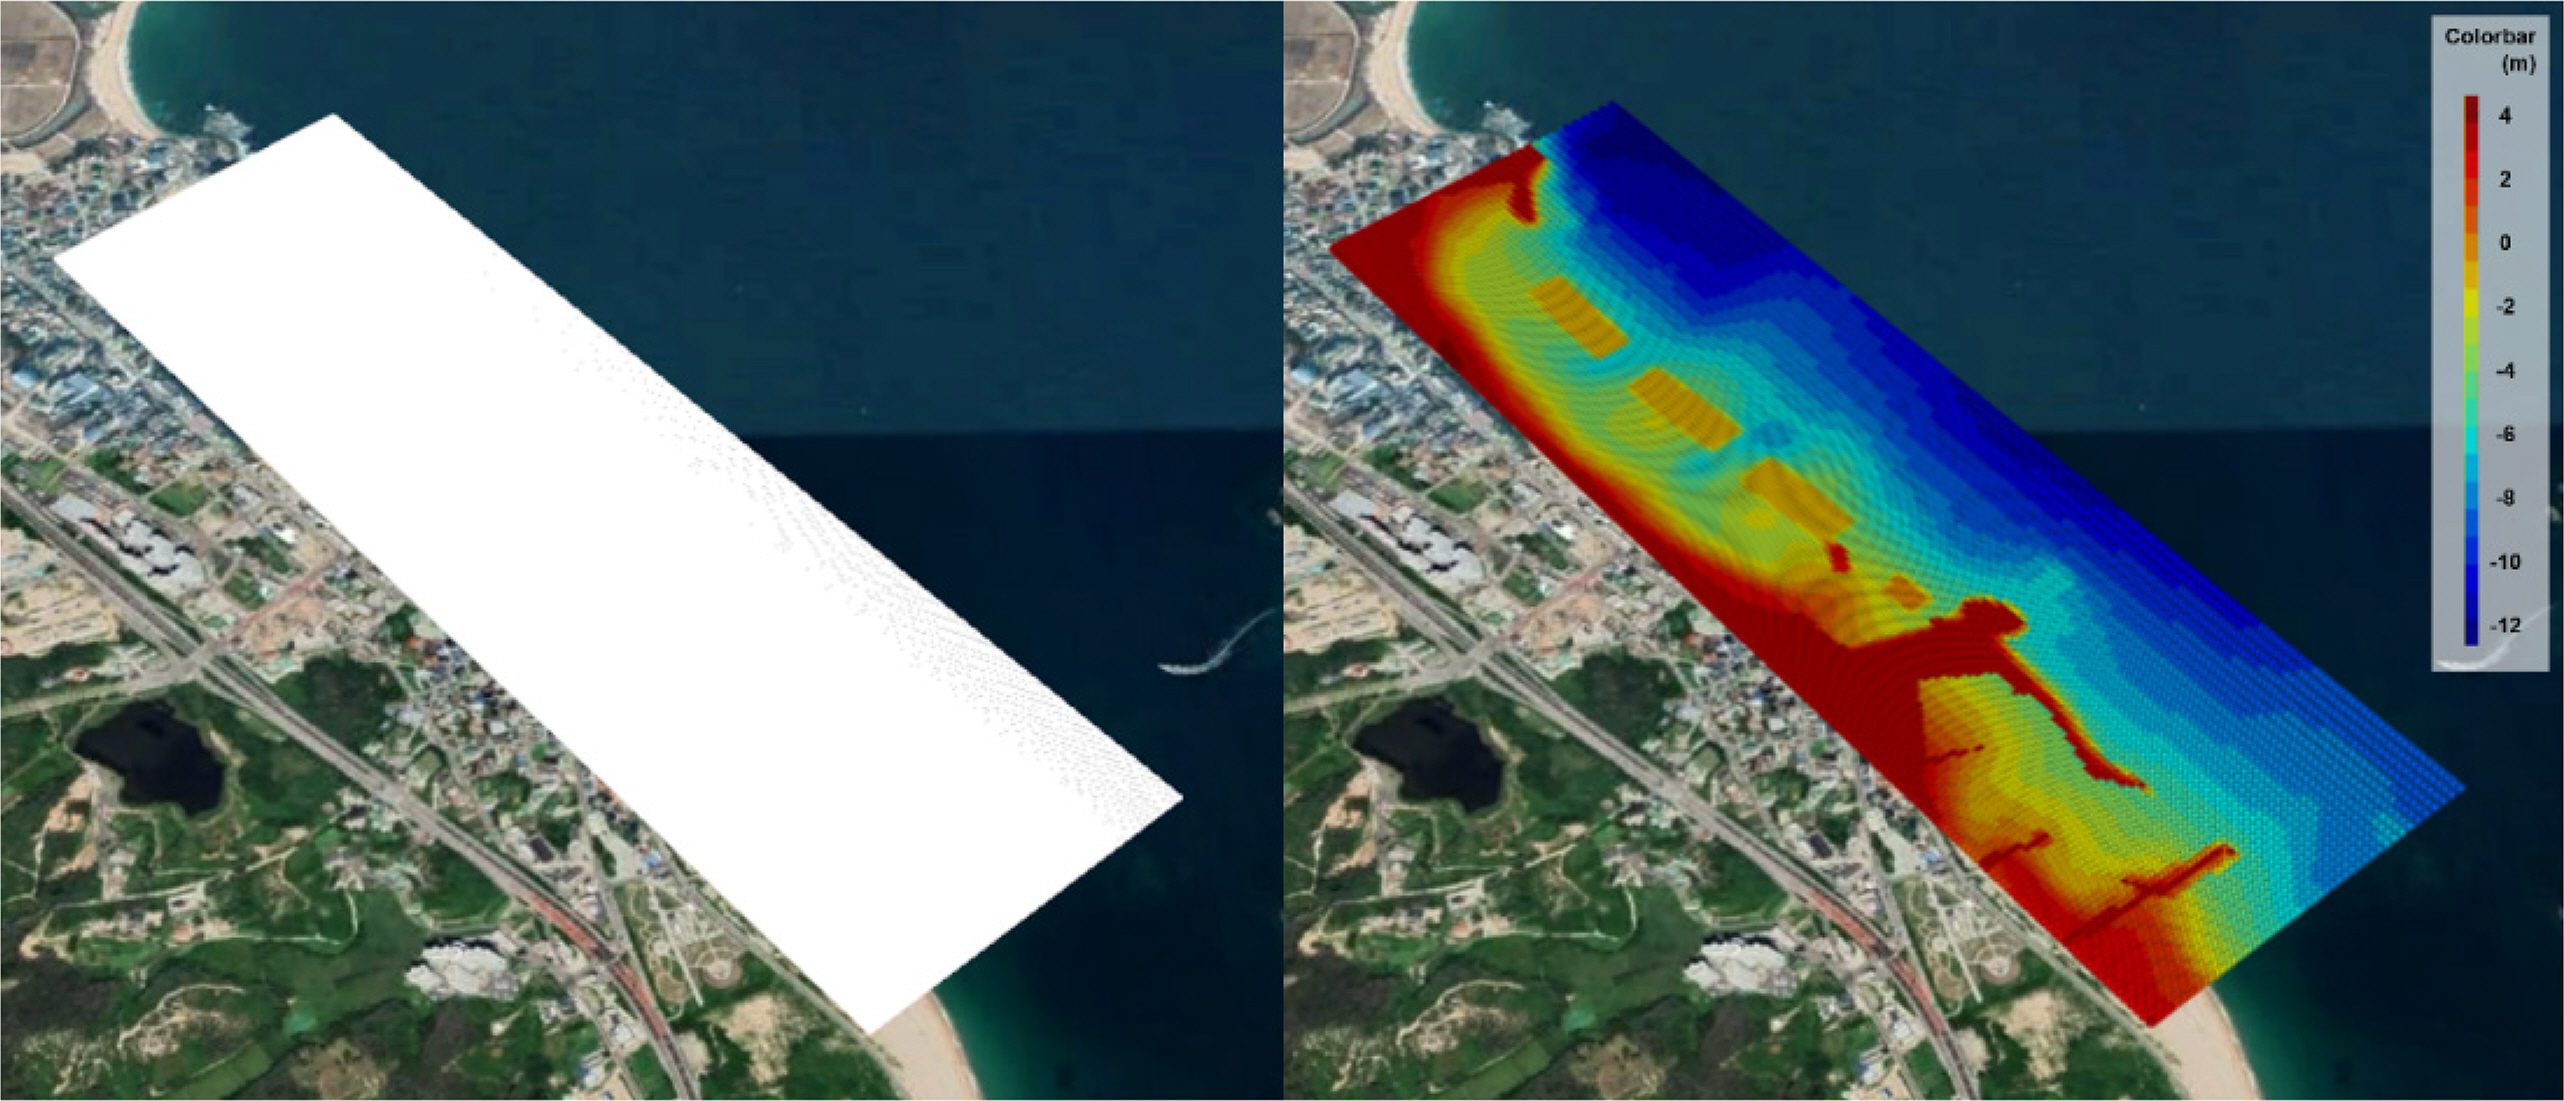
The simulation domain included all areas from Cheonjin to Bongpo Port, considering ESE storm waves that interact with the latter Port as oblique incident waves toward the coastline. For efficient calculation, 244 (cross-shore) ├Ś 289 (alongshore) variable grids were formed (Fig. 5). Different grid resolutions were applied depending on the section considering stabilization conditions. First, in the case of the cross-shore direction, the grid was constructed so that the grid size could range from 2ŌĆō4 m near the open sea and 0.9ŌĆō1.2 m near the surf zone and SBWs. In the case of the alongshore direction, the grid size ranged from 3.6ŌĆō5 m for Bongpo Beach (where SBWs were installed) and 6ŌĆō10 m for other areas, indicating a smaller grid size for the area of interest with SBWs.
The number of layers in the vertical direction significantly impacts computation times. In this study, four layers were divided considering the distance between the SBWs located in Bongpo Beach and the sea level is approximately 50 cm. The water depth data before the occurrence of Typhoon Maysak was used for bottom boundary conditions (Fig. 5), with the porosity coefficient set in the grid cells where SBWs were located regardless of the layers. For the physical coefficients and input conditions required in the numerical simulation, the default values presented in the SWASH model user manual were used as presented in Table 3 (SWASH team, 2020). Next, the diameter of the structureŌĆÖs size was applied. The significant wave height (Hs), peak period (Tp), and peak wave direction (Dp) data were used as open-sea wave boundary conditions, with the input reduction tool (Deltares, 2017) applied for the wave data during the typhoon period. A total of ten representative wave conditions (Table 4) were created, with the 2D Joint North Sea wave project (JONSWAP) spectrum simulated every 30 minutes. To minimize reflection in the open sea boundary, except for the incident wave boundary, a sponge layer with a length of 3ŌĆō4 times the wavelength was applied. The simulation time was set to 1 h considering the time required for the stabilization of wave-induced currents. The significant wave height and the flow velocity and direction by layer for analyzing flow characteristics were output using 30-minute average values. SWASH version 7.01 was used for all numerical simulations, and numerical simulations were performed with 36 nodes in parallel using MPI (Message passing interface) to reduce the computation time.
4. Numerical Simulation Results
The results of previous studies indicate that the flow pattern in the hinterland of SBWs significantly varies depending on the installation location of SBWs, wave height, and wave direction. As such, input wave conditions were classified into ENE and ESE waves in this study, as described in section 2.2, with the flow simulation results of each case analyzed. Among the flow velocity simulation results by layer, the top layer adjacent to the sea level (near-surface layer, k1) and the bottom layer closest to the bottom (near-bottom layer, k4) were analyzed and indirectly compared with the topographic observation results because the simulation results of the near-surface layer (k1) can easily explain the flow pattern that occurs on the water surface while the results of the near-bottom layer (k4) can easily describe the overall sediment transport pattern that occurs at the seabed of the coast. In this study, among the ten wave conditions for numerical simulation, two ENE and two ESE waves with high appearance rates and wave energy were calculated and the simulation results were analyzed (Table 4, Cases 1ŌĆō4).
4.1 Significant Wave Height Results According to the Incident Wave Condition
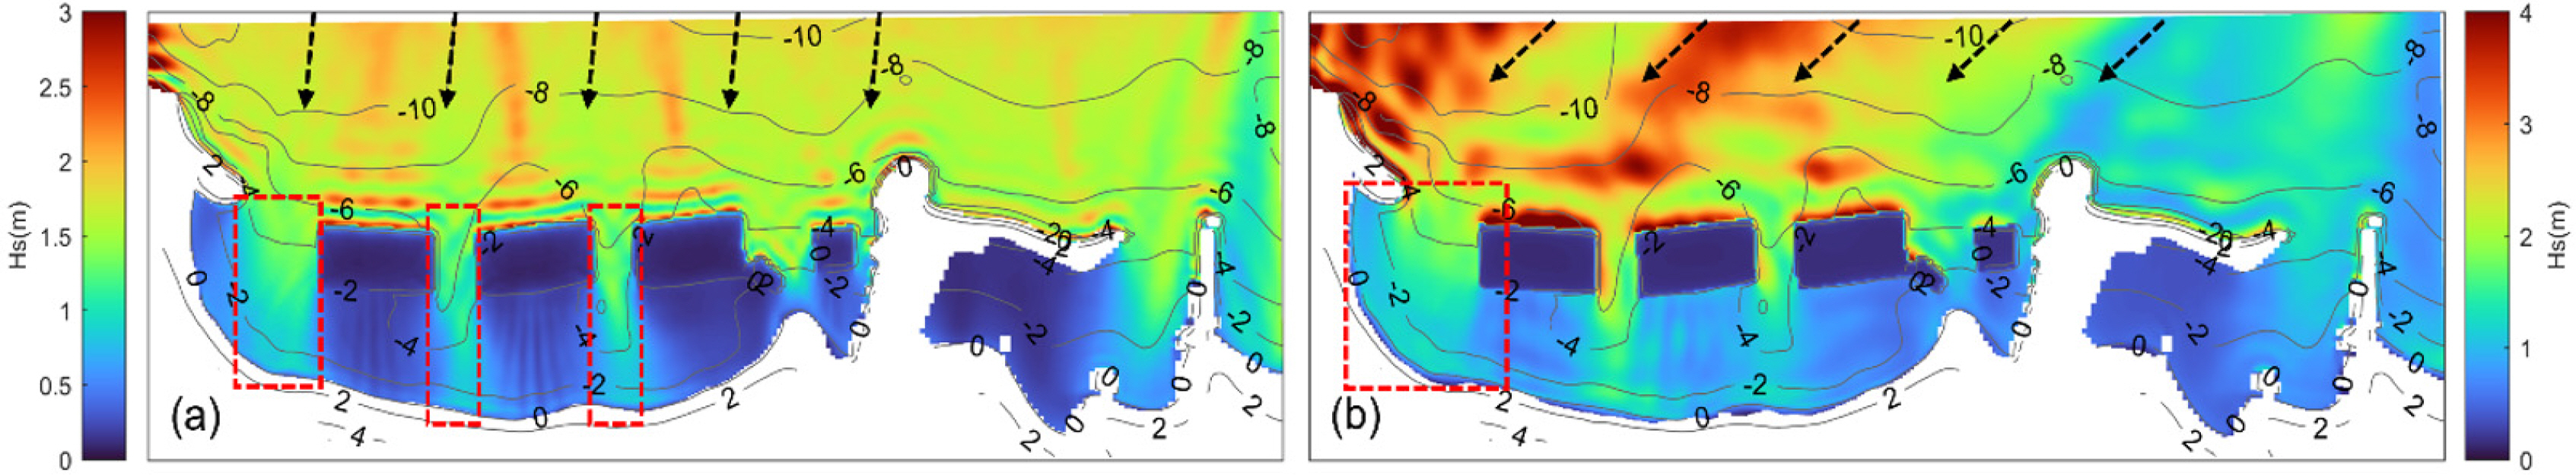
When SBWs are installed as in Bongpo Beach, erosion and accretion at the opening and hinterland of the SBWs show different characteristics depending on the direction of the incident waves from the open sea, analyzed using the wave transformation simulation results of Bongpo Beach after introducing ENE and ESE waves are shown in Fig. 6, with areas with relatively high wave energy marked with red dotted lines. First, concerning ENE waves, a high significant wave height of more than 1.5 m reached the coastline through the openings of the SBWs (Fig. 6(a)), and the corresponding locations were eroded by more than 0.8 in the actual topographic observation. In the case of ESE waves, significant wave heights of approximately 2 m were introduced into the openings, and the entire hinterland of Cheonjin Port was particularly affected (Fig. 6(b)). Such wave energy distribution behind SBWs causes a rise in water level and the generation of diffracted waves in the hinterland, which is the main factor that develops cross-shore and longshore flows through the openings of SBWs.
4.2 Flow Simulation Results by Normal Incident Waves (ENE Series)
First, among the normal incident wave conditions, the flow patterns simulated in cases 1 and 2 with relatively high appearance rates and wave energy are shown in Fig. 7 and were analyzed. Figs. 7(a) to 7(b) show the simulation results at the near-surface layer (k1), while Figs. 7(c) to 7(d) show the simulation results at the near-bottom layer (k4). Overall, the flow patterns of both cases are not significantly different, and their magnitudes are somewhat different depending on the wave direction. The analysis of the flow velocity distribution shows that high flow velocity occurred near the coastline for both layers and that a large amount of sand was transported; in addition, topographic changes were caused in areas with a flow velocity of more than 0.4 m/s. For the flow of the k4 layer, 0.7 m/s or higher flows in the ESE direction were generated near the coastline of the hinterland of the SBW openings where a large amount of wave energy was introduced, and the flow velocity in the hinterland of SBWs 2 and 3 decreased. These flow patterns were similar to the erosion and accretion patterns in sections 2 and 3, indicating that the flow was well reproduced. In section 1, as the erosion and accretion patterns were properly reproduced only in the hinterland of SBW 1, the section was divided again into sections 1-A and 1-B. In section 1-B area of the k1 layer, a strong flow (0.7 m/s or higher) was developed toward the hinterland of SBW 1 (S series) due to the strong incident wave energy through the opening between the Cheonjin Port breakwater and SBW 1 (Figs. 7 (a)ŌĆō(b)), causing a strong flow (0.6 m/s or higher) toward the opening between SBWs 1 and 2 in the k4 layer (Figs. 7 (c)ŌĆō(d)), effectively explaining the erosion and accretion patterns in section 1-B. However, in section 1-A, it is difficult to explain the erosion and accretion patterns in the opening between the Cheonjin Port breakwater and SBW with the simulated flow velocity patterns, indicating that ENE waves have limited influence on the sediment transport and topographic changes in section 1-A.
4.3 Flow Simulation Results by Oblique Incident Waves (ESE Series)
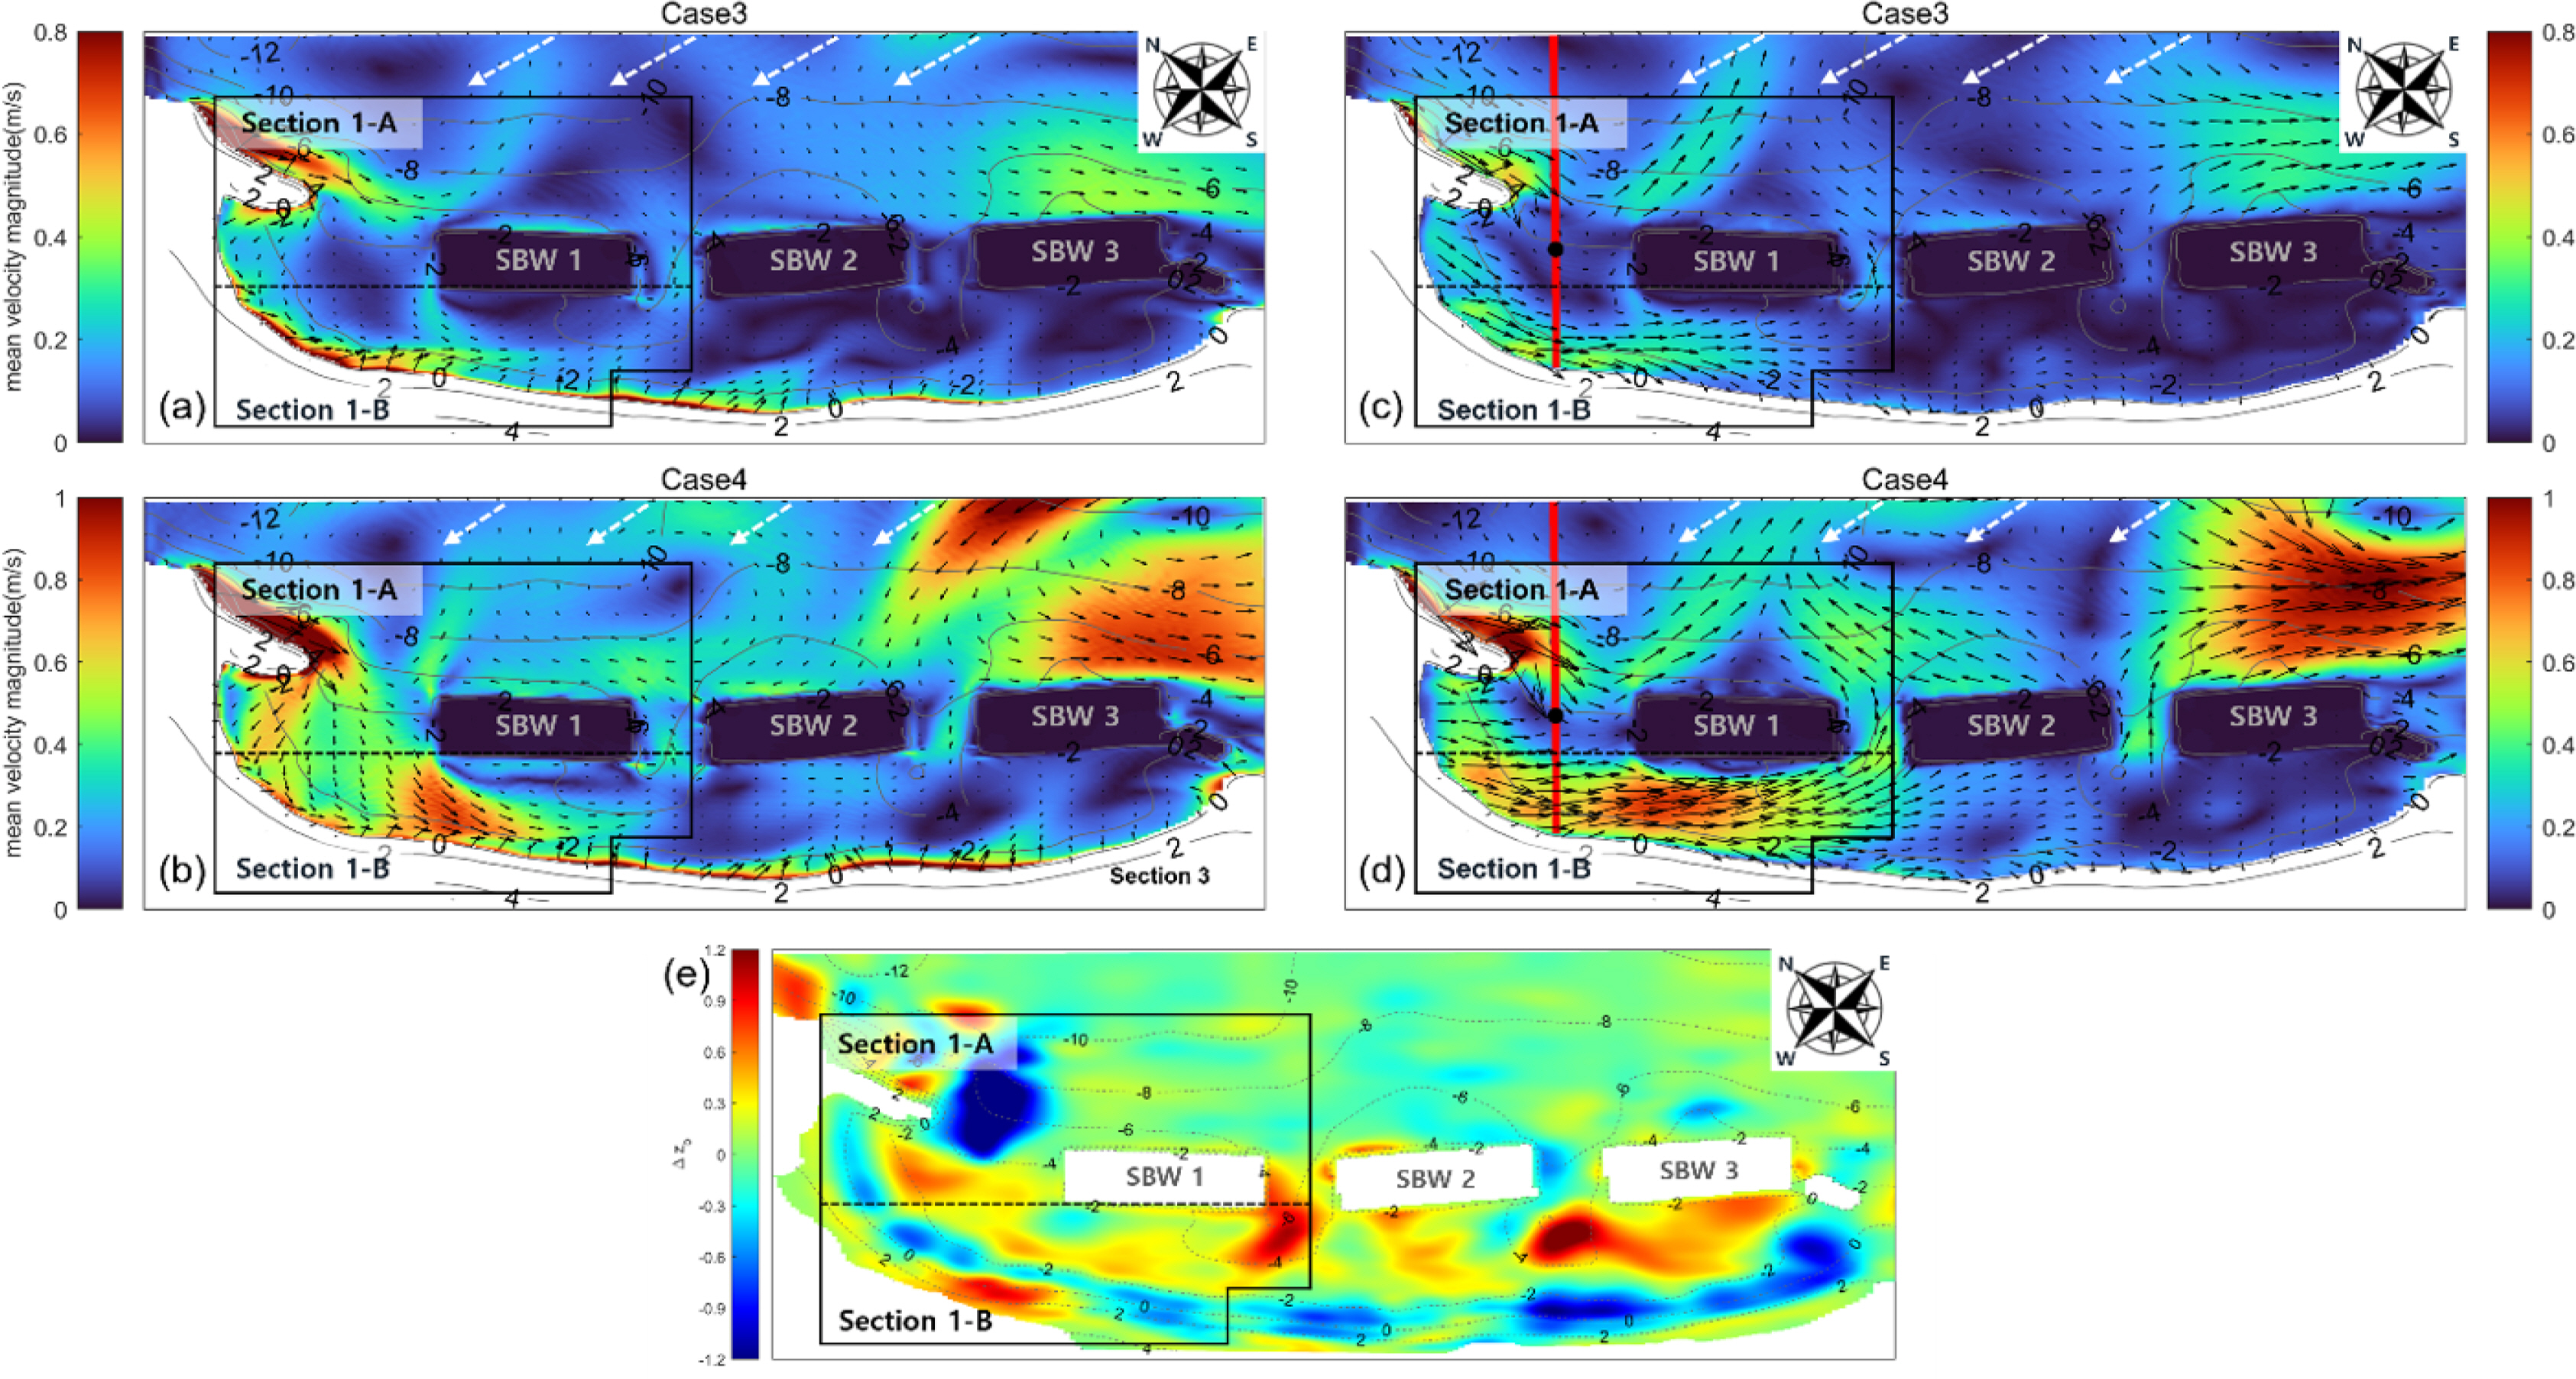
Among the ESE incident wave conditions, the numerical simulation results of cases 3 and 4 with relatively high wave energy and appearance rates are shown in Fig. 8. When ESE waves were introduced, the flow near the coastline was strongly developed in the near-surface layer (k1) and its magnitude was simulated to be more than 0.8 m/s (Figs. 8 (a)ŌĆō(b)). In the case of the near-bottom layer (k4) that significantly affects sediment transport, it appears that the sediment transport of the coast was active when the flow velocity exceeded 0.4 m/s, which was particularly significant in section 1. This means that ESE waves caused sediment transport and topographic changes in section 1. A strong flow (0.6 m/s or higher) toward SBW 1 (SSE series) and a strong ES-series flow in the hinterland of SBW 1 (0.5 m/s or higher) occurred through the combination of the relatively high wave energy introduced from the open sea, the reflected waves by the Cheonjin Port breakwater, and the refraction and diffraction of waves. These flows caused erosion in the corresponding areas and some of the lost sand was deposited in section 1-A with a relatively low flow velocity (0.1 m/s or less), consistent with the topographic observation results. This pattern is prominent in case 4 with relatively high wave energy (Fig. 8(d)).
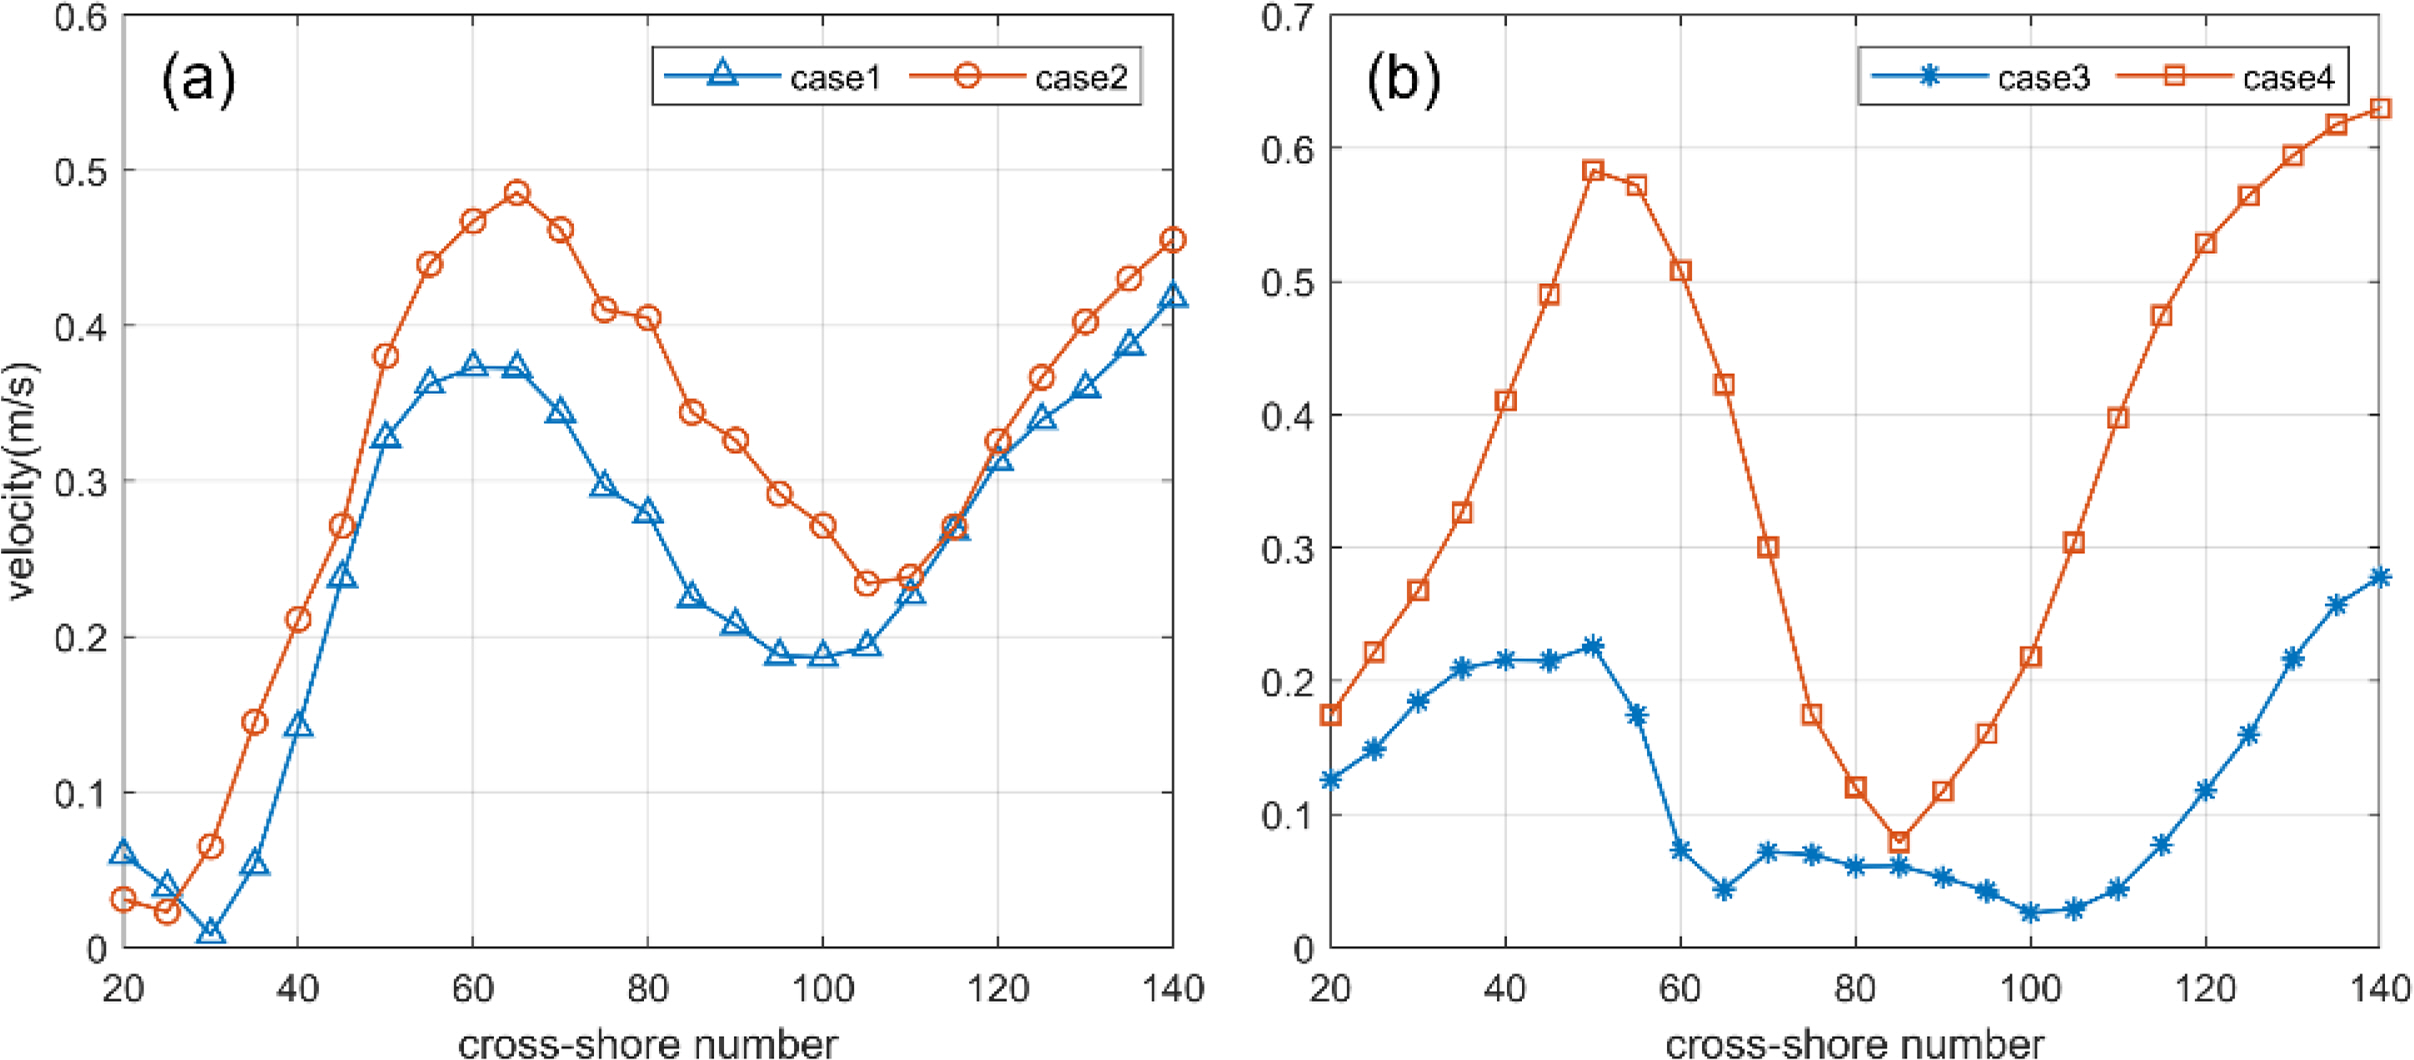
Fig. 9 shows the flow velocity as red solid lines perpendicular to the coastline marked in Figs. 7(c) to 7(d) and Figs. 8(c) to 8(d). The flow velocity decreases in the opening between the Cheonjin Port breakwater and SBW 1, and that accretion is dominant in this area. The flow velocity variance was analyzed to be larger in Fig. 9(b) where ESE waves were simulated compared to Fig. 9(a) where ENE waves were introduced. This shows that ESE waves caused topographic changes more dominantly in section 1-A (opening between the Cheonjin Port breakwater and SBW 1) even though erosion and accretion were caused by both ENE and ESE waves.
5. Conclusions
In this study, numerical simulation was performed using field observation data to precisely analyze flow patterns that cause topographic changes and sediment transport in the coast where submerged breakwaters (SBWs) are installed, with the simulation results indirectly compared with topographic change observation data before and after a typhoon. Bongpo Beach, with SBWs installed through coastal maintenance projects tackling the continuous erosion problem, was selected as the study area. The wave and water depth data during the Typhoon Maysak period collected from Bongpo Beach were analyzed, revealing that both ENE waves, introduced in a direction perpendicular to the coastline, and ESE waves, introduced in oblique directions to the coastline, are dominant. In particular, it is considered that ESE waves caused sediment transport differently from large height swell-like waves in winter because they contain several high waves with a height of more than 3 m. Six water depth observations were performed from July 2020 to March 2021. Among them, the water depth data before and after Typhoon Maysak were compared and analyzed to examine the topographic changes in Bongpo Beach caused by storm waves (Fig. 3). The sand volume was calculated in places where the water depth difference was significant for effective analysis. Based on these calculations, Bongpo Beach was divided into three sections. The analysis results show that strong erosion occurred in areas close to the coastline of Bongpo Beach after the typhoon hit, similar to the characteristics of the 2-cell circulation pattern among the patterns presented in previous studies (Fig. 4(a)). However, there are limitations in understanding this phenomenon with observation data alone because structures other than the SBWs installed in Bongpo Beach, such as the Cheonjin Port breakwater and jetty, and various incident wave conditions transform the circulation patterns generated in the hinterland of the SBWs and create complex flows. To simulate such coastal flows, SWASH, a quasi-3D numerical model that can simulate vertical and horizontal flows simultaneously, was used. The simulation domain included all areas from Cheonjin Port to Bongpo Port, considering ESE waves introduced in oblique directions, and the grids of the area of interest with SBWs were more densely constructed using variable grids (curvilinear & nonequidistance grid) to improve the efficiency of numerical simulation. Four layers were divided in the vertical direction, with ten cases with different wave conditions created by applying the input reduction tool to the wave data obtained from acoustic waves and currents (AWAC). The simulation results showed that the direction of incident waves acted as a main factor that determines the flow pattern and topographic changes in Bongpo Beach where SBWs were installed and that the flows in the near-surface layer (k1) and near-bottom layer (k4) easily explain the overall sediment transport pattern in Bongpo Beach. When ENE waves were dominant, the flows toward the SBW hinterland in the near-bottom layer (k4) were similar to the erosion and accretion patterns in sections 2 and 3. In section 1-B, the overall flows in the near-surface layer (k1) and near-bottom layer (k4) well explained the erosion and accretion patterns. In contrast, in section 1-A, when ESE waves were dominant, the strong flow near SBW 1 and the section with low flow velocity in the near-bottom layer (k4) were found to be similar to the erosion and accretion patterns. In particular, the analysis of the flow velocity variance shows that topographic changes in section 1-A were more dominantly caused by ESE waves than ENS waves.
These results indicate that it is possible to simulate the flow in Bongpo Beach where SBWs are installed by layer through the SWASH model and that the phenomena of sections where sediment transport and topographic changes are dominant can be inferred according to the incident wave conditions. This study failed to directly compare the numerical simulation results of flow by layer with the wave and flow velocity observation data during high wave occurrence periods, such as typhoons; however, the reliability of the model is considered high based on the results derived through an indirect comparison with the actual topographic change patterns. In addition, a comparison of the results of the quasi-3D model and the depth-averaged 2D model suggested that the quasi-3D model can predict the spatial flow pattern and sediment transport pattern in the hinterland of SBWs more accurately under high wave conditions, such as typhoons, which will be significantly helpful in designing efficient SBW arrangement plans.