J. Ocean Eng. Technol. Search

CLOSE


J. Ocean Eng. Technol. > Volume 37(2); 2023 > Article
Park, Jung, and Seo: Investigation of Applying Technical Measures for Improving Energy Efficiency Design Index (EEDI) for KCS and KVLCC2

Abstract

While extensive research is being conducted to reduce greenhouse gases in industrial fields, the International Maritime Organization (IMO) has implemented regulations to actively reduce CO2 emissions from ships, such as energy efficiency design index (EEDI), energy efficiency existing ship index (EEXI), energy efficiency operational indicator (EEOI), and carbon intensity indicator (CII). These regulations play an important role for the design and operation of ships. However, the calculation of the index and indicator might be complex depending on the types and size of the ship. Here, to calculate the EEDI of two target vessels, first, the ships were set as Deadweight (DWT) 50K container and 300K very large crude-oil carrier (VLCC) considering the type and size of those ships along with the engine types and power. Equations and parameters from the marine pollution treaty (MARPOL) Annex VI, IMO marine environment protection committee (MEPC) resolution were used to estimate the EEDI and their changes. Technical measures were subsequently applied to satisfy the IMO regulations, such as reducing speed, energy saving devices (ESD), and onboard CO2 capture system. Process simulation model using Aspen Plus v10 was developed for the onboard CO2 capture system. The obtained results suggested that the fuel change from Marine diesel oil (MDO) to liquefied natural gas (LNG) was the most effective way to reduce EEDI, considering the limited supply of the alternative clean fuels. Decreasing ship speed was the next effective option to meet the regulation until Phase 4. In case of container, the attained EEDI while converting fuel from Diesel oil (DO) to LNG was reduced by 27.35%. With speed reduction, the EEDI was improved by 21.76% of the EEDI based on DO. Pertaining to VLCC, 27.31% and 22.10% improvements were observed, which were comparable to those for the container. However, for both vessels, additional measure is required to meet Phase 5, demanding the reduction of 70%. Therefore, onboard CO2 capture system was designed for both KCS (Korea Research Institute of Ships & Ocean Engineering (KRISO) container ship) and KVLCC2 (KRISO VLCC) to meet the Phase 5 standard in the process simulation. The absorber column was designed with a diameter of 1.2–3.5 m and height of 11.3 m. The stripper column was 0.6–1.5 m in diameter and 8.8–9.6 m in height. The obtained results suggested that a combination of ESD, speed reduction, and fuel change was effective for reducing the EEDI; and onboard CO2 capture system may be required for Phase 5.

1. Introduction

Global warming has caused many problems worldwide. To address such problems, eco-friendly decarbonization regulations have been implemented. In the ship market, the International Maritime Organization (IMO), which oversees maritime affairs around the world, has also enacted related regulations. For newly built ships from 2013, the energy efficiency design index (EEDI), which indicates carbon dioxide emissions for transporting one ton of cargo over one nautical mile, must conform with the regulations. To this end, designing ships with high energy efficiency right from the design stage is necessary. Since the amount to be reduced increases for each phase, research has been actively conducted to improve the hull form and propulsion systems (KIOST, 2016).
To improve the index, a remodeling method of the propulsion system that uses liquefied natural gas (LNG) rather than low-sulfur fuel oil or conventional bunker fuels is required. Jung (2014), Jung et al. (2022), and marine environment protection committee (MEPC) 79/7/4 (IMO, 2022) proposed a method of installing an onboard carbon capture and storage (OCCS) system in ships, to capture CO2 emitted from ships.
Methods to reduce resistance by remodeling the bow shape and improve the propulsion efficiency by installing energy saving devices (ESDs) before and after the stern propeller are also available. In general, ESD installation increases the propulsion efficiency by 5% on average based on the transmission power. Song et al. (2015) applied a system that generates an acceleration effect using a duct and improves propulsion by recovering the kinetic energy lost in the wake of the propeller using a pre-swirl stator to a 176K bulk carrier. Kim et al. (2015) conducted computational fluid dynamics (CFD) analysis and model tests by attaching the developed pre-swirl stator and duct-combined pre-swirl stator to the 317K very large crude oil carrier (VLCC) hull form. They found that the transmission power was reduced by 3% for the pre-swirl stator and 6.1% for the duct-combined pre-swirl stator. Park and Cho (2017) modified the bulbous bow to ensure suitability for the slow steaming of an 8,600 TEU container ship and applied the operational efficiency index calculation formula modified based on a comparison of fuel consumption before and after the modification. They derived the index reduction rate and carbon dioxide reduction before and after the modification, according to the supercharger operating conditions at 14 to 20 knots (25.93 to 37.04 km/h). Choi and Rho (2011) mentioned the limitations of the fuel consumption rate calculation method for cargo volume in determining the energy efficiency operational indicator (EEOI) of IMO and presented an improved calculation formula for the indicator that applies the fuel consumption per kW related to the engine load. They also calculated and analyzed carbon dioxide emissions by applying actual ship operation data to the improved calculation formula. Shin et al. (2013) conducted research on the design, numerical analysis, and evaluation methods related to the ESD development procedure for a 73K tanker. They confirmed the fuel-saving effect of 4–6% when the developed ESD was applied to various low-speed and large full form ship.
Application of various technical and operational measures for satisfying the environmental regulations presented by IMO is necessary. Thus far, various technical measures have been proposed, including ship speed reduction, hull form improvement, low-friction paint utilization, wind power propulsion, air lubrication system, waste heat recovery system, and OCCS. Along with these, certain operational measures, such as route optimization, operating speed optimization, trim optimization, optimal fleet management, port loading/unloading optimization, and shore to ship (S2S), have also been considered. Here, ships that correspond to KCS (Korea Research Institute of Ships & Ocean Engineering (KRISO) container ship) and KVLCC2 (KRISO VLCC) types were set as target vessels, and an attempt was made to examine improved EEDI and IMO regulations under the application of technical measures, such as speed reduction, ESD installation, and OCCS. To this end, the EEDI calculation formula presented by IMO was used. For the efficiency improvement effect by ESD, the values in the literature were applied. In the case of OCCS, a system of the required size was designed through process simulation. It is expected to prove the effect by means of mandatory CO2 reduction in ships and the justification for OCCS, making research in the related field more active.

2. EEDI Calculation for KCS and KVLCC2

2.1 Calculation Method

The contents of MEPC.203(62) (IMO, 2011), MEPC.245(66) (IMO, 2014), and MEPC.308(73) (IMO, 2018) were referred to for contents related to EEDI calculation. Whether this index satisfies IMO regulations can be confirmed by obtaining and comparing the Attained EEDI, Reference line, and Required EEDI values. Attained EEDI is the value calculated using Eq. (1) below. Reference line is a reference value for calculating the required EEDI for each ship type. The required EEDI can be obtained by substituting the reduction factor (X ) for each phase according to the year into the reference line value. The calculated values must satisfy the following equation. The X values are specified in Table 1. Since different values are applied to container ships depending on their size, they are listed in Table 2.
(1)
AttainedEEDIRequiredEEDI=(1X100)×Referencelinevalue
For Phase 4, however, the X value was set to 50, as regulations are reinforced, unlike in Phase 3. For the final target of 70% reduction, the reduction factor X value of Phase 5 was set to 70.
The Reference line value is obtained using Eq. (2) below, and the a, b, and c values can be obtained from Table 3.
(2)
Referencelinevalue=a×bc
The EEDI calculation formula and contents on the required coefficients are as follows:
(3)
EEDI=(PME×CFME×SFCME)+(PAE×CFAE×SFCAE)Capacity×Vref
  • PME : 75% of the rated installed power (Maximum continuous rating, MCR) for main engine (kW)

  • CF : Conversion factor between fuel consumption and CO2 emission (t-CO2/t-fuel) (see Table 4)

  • SFC : Certified specific fuel consumption (g/kWh)

  • PAE : Power of auxiliary engine (kW)

  • Capacity : Deadweight (DWT) (t)

  • Vref : Ship speed, measured in nautical miles per hour (knot), in deep water under the condition corresponding to the capacity (nm/h)

Attained EEDI is obtained by substituting the corresponding coefficients of the target vessels into Eq. (3), and the reference line value is obtained using Eq. (2). After obtaining the required EEDI using Eq. (1), its satisfaction is examined through a comparison.

2.1.1 Main assumptions for calculation

Prior to the calculation of the index, certain coefficients were assumed for calculation because data from actual ships were not sufficient. The assumed values and grounds for them are as follows:
  • (1) PME

    By referring to the main engine power of the target vessel selected in the capacity term below and the engine manufacturer data (MAN Energy Solutions, 2019), the dual fuel (fuel oil + methane) main engine with the most similar value was selected, and 75% of its maximum continuous rating (MCR) was selected.
  • (2) SFC

    In the case of the main engine, since the specific fuel consumption (SFC), specific gas consumption (SGC), and specific pilot oil consumption (SPOC) values at MCR 75% are specified, they were used as references.
    In the case of the auxiliary engine, the SFC value was obtained by referring to the engine manufacturer data (MAN Energy Solutions, 2019). The SGC and SPOC of the auxiliary engine were calculated using the same ratio as the SFC ratio between the main and auxiliary engines.
  • (3) PAE

    PAE can be obtained by multiplying PME by 0.025 and adding 250.
  • (4) Capacity

    Among the actual ship data, DWT was designated as a range. DWT was determined for actual ships that can obtain the main engine power values within the range.
  • (5) Vref

    The operating speed for container ships and VLCC was set to Vref.

2.2 Target Vessels

Here, the ship type, hull form, and size for target vessels were required to calculate the index. A 50K DWT KCS container ship and a 300K DWT KVLCC2 crude oil tanker, which are open hull forms, were selected as target vessels. Their detailed information is as follows:
  • (1) KCS container ship

    • - DWT: 55,387 t

    • - Actual main engine type: 8K98MC-C

    • - Actual main engine power: 34,071 kW

    • - Selected main engine type: MAN B&W, 5G95MEGI

    • - Selected main engine power: 34,350 kW (MCR)

  • (2) KVLCC2 crude oil tanker

    • - DWT: 309,097 t

    • - Actual main engine type: 7S70MC-C

    • - Actual main engine power: 24,446 kW

    • - Selected main engine type: MAN B&W, 7S70MEGI

    • - Selected main engine power: 24,010 kW (MCR)

Therefore, the vessels used for calculation were judged to be suitable for calculation because their size and engine power were identical or similar to those of actual ships.

2.3 Calculation Results

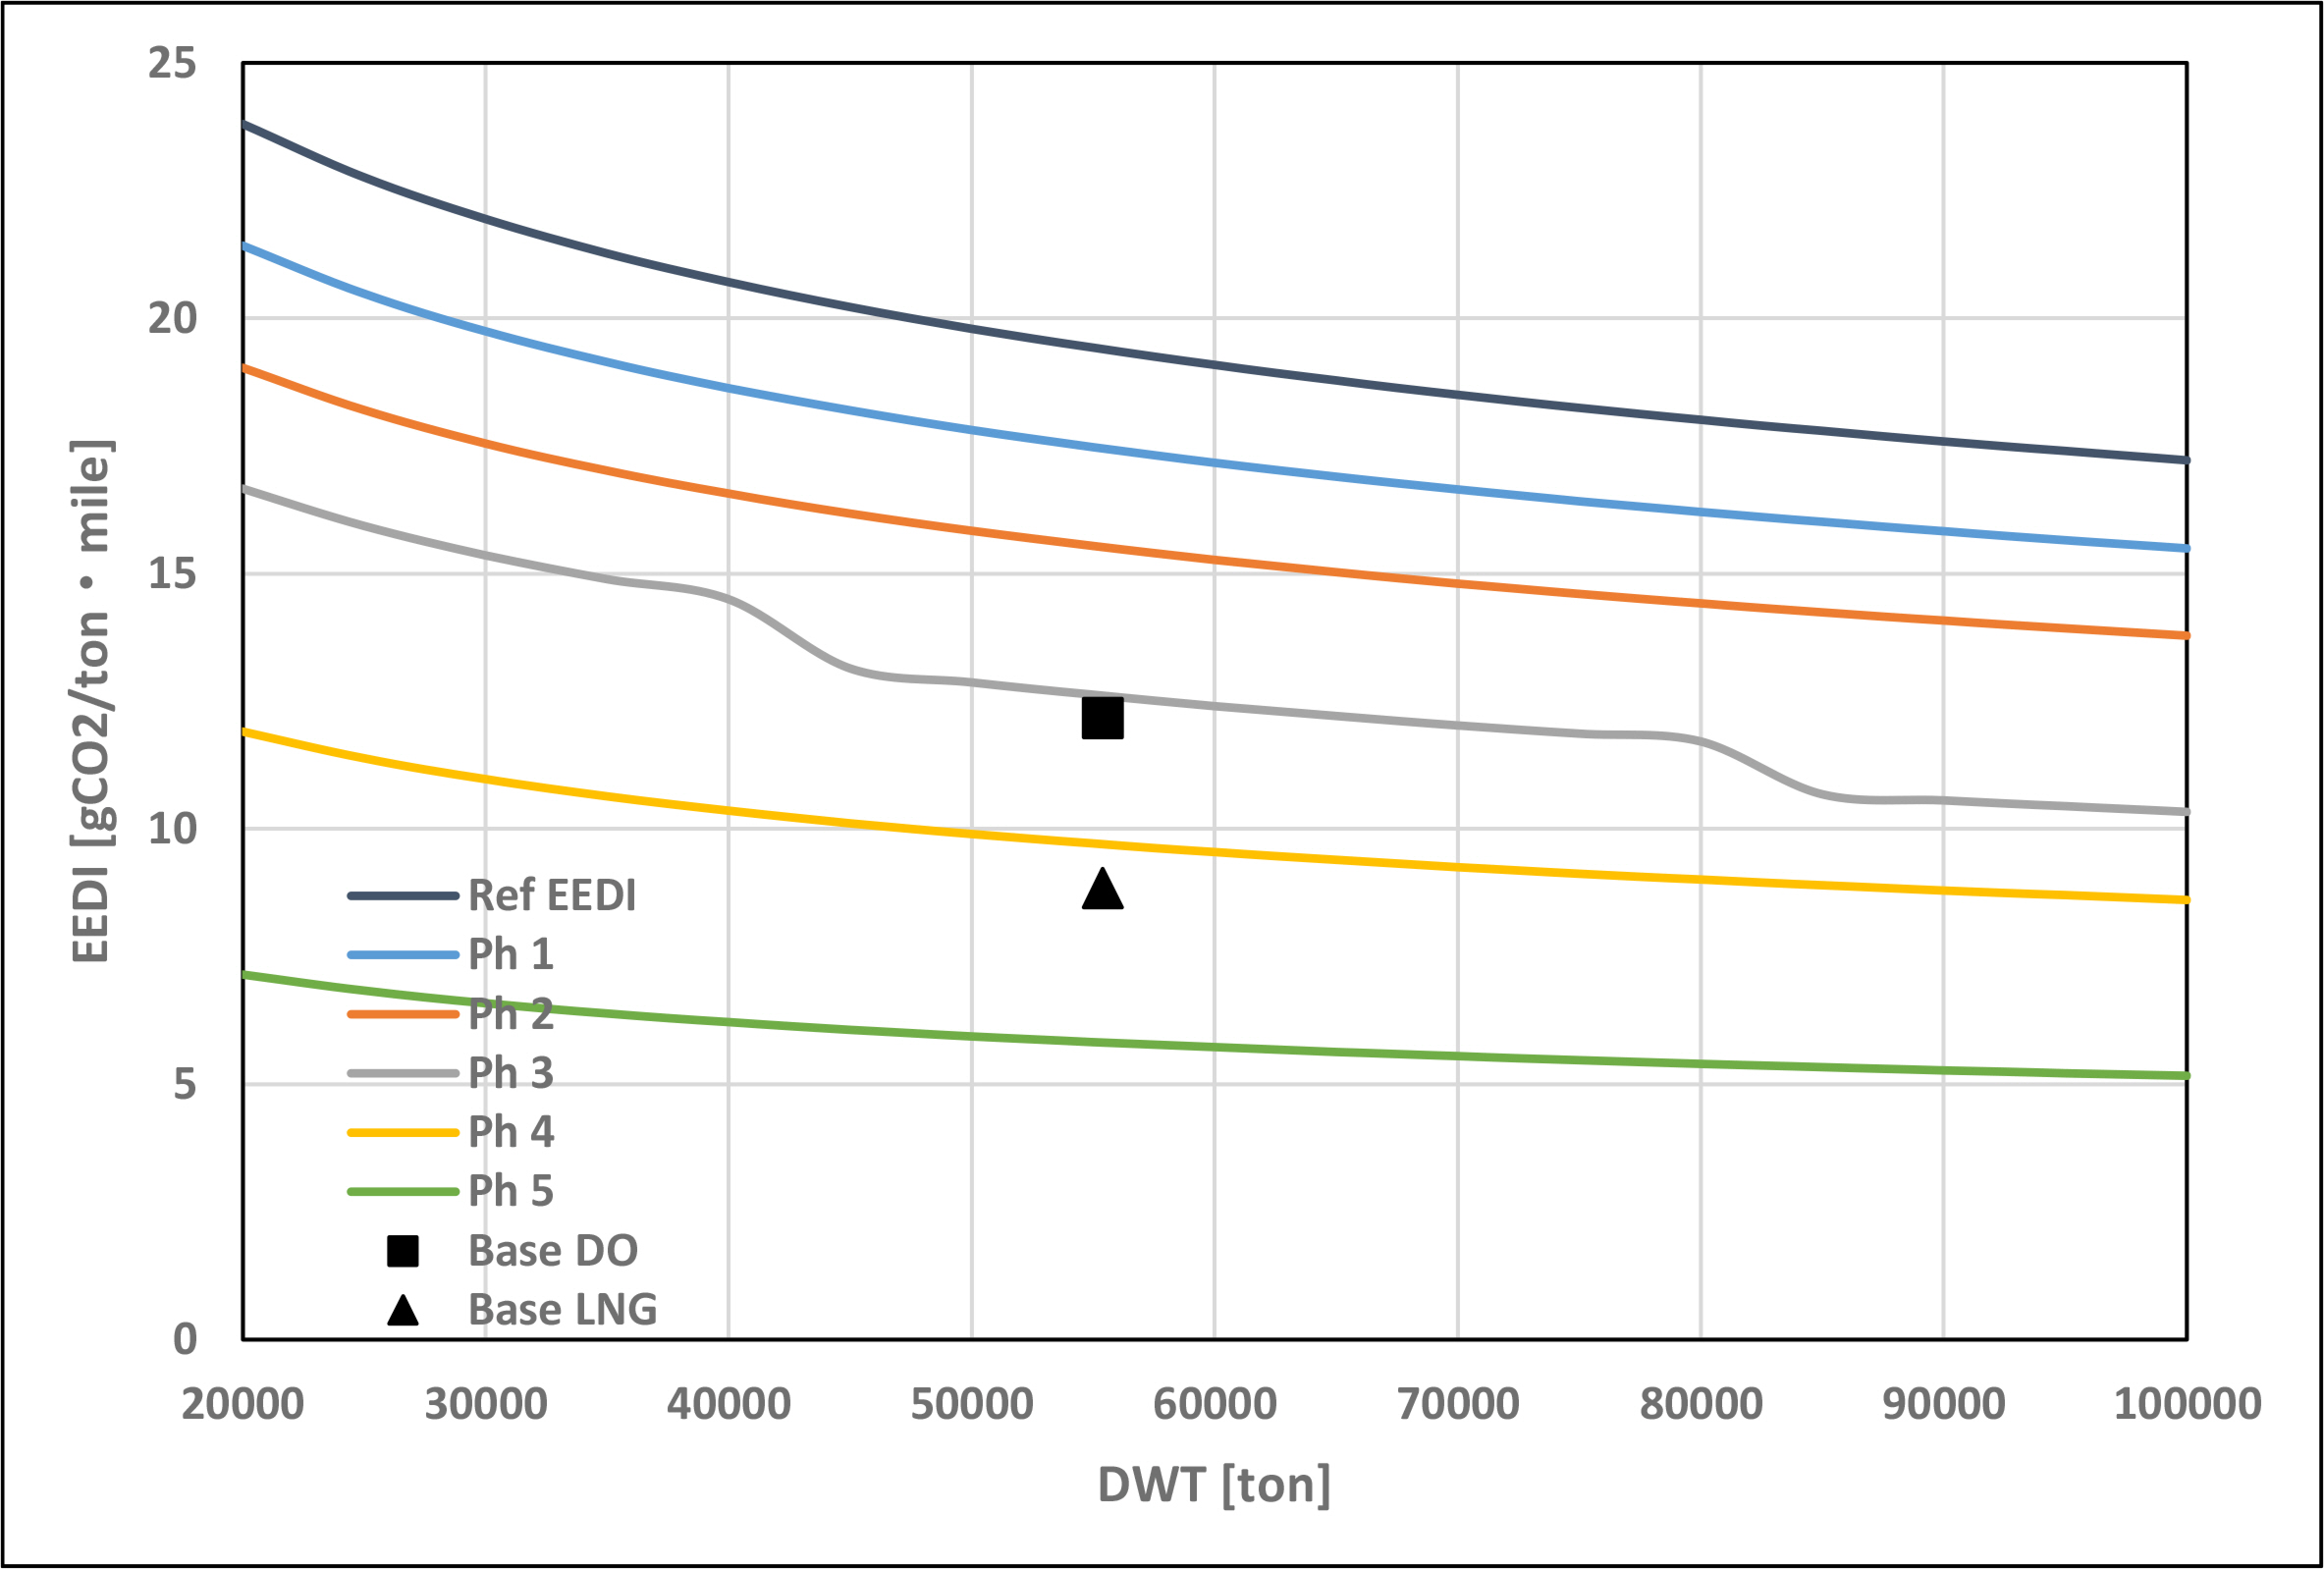
2.3.1 KCS container ship

First, the reference line value of the container ship is calculated using Eq. (2) and Table 2. The required EEDI at each phase can be calculated as follows. The unit is gCO2/tㆍnmile.
(4)
Referencelinevalue=174.22×553870.201=19.394
(5)
RequiredEEDIPh2=(120100)×19.394=15.515
(6)
RequiredEEDIPh3=(135100)×19.394=12.606
(7)
RequiredEEDIPh4=(150100)×19.394=9.697
(8)
RequiredEEDIPh5=(170100)×19.394=5.818
The attained EEDI was calculated for diesel and LNG modes in Eq. (9) and (10) of the main engine and auxiliary engines, respectively, and the results were compared with the required EEDI from Eq. (5) to (8) to check if the requirements were fulfilled.
(9)
AttainedEEDIDO=(25762.5×3.206×162.5)+(1108.75×3.206×204.9)55387×21=12.166
(10)
AttainedEEDILNG=(25762.5×(3.206×3.0+2.75×134.125))+(1108.75×(3.206×3.811+2.75×169.364))55387×21=8.838
Both the EEDI calculated using the above calculation results and the IMO regulations are shown in Fig. 1. For the container ship, Phase 1, 2, and 3 can be satisfied when diesel is used as fuel. To satisfy Phase 4 and above, additional measures must be applied. When LNG is used as fuel, however, regulations of up to Phase 4 can be complied with.

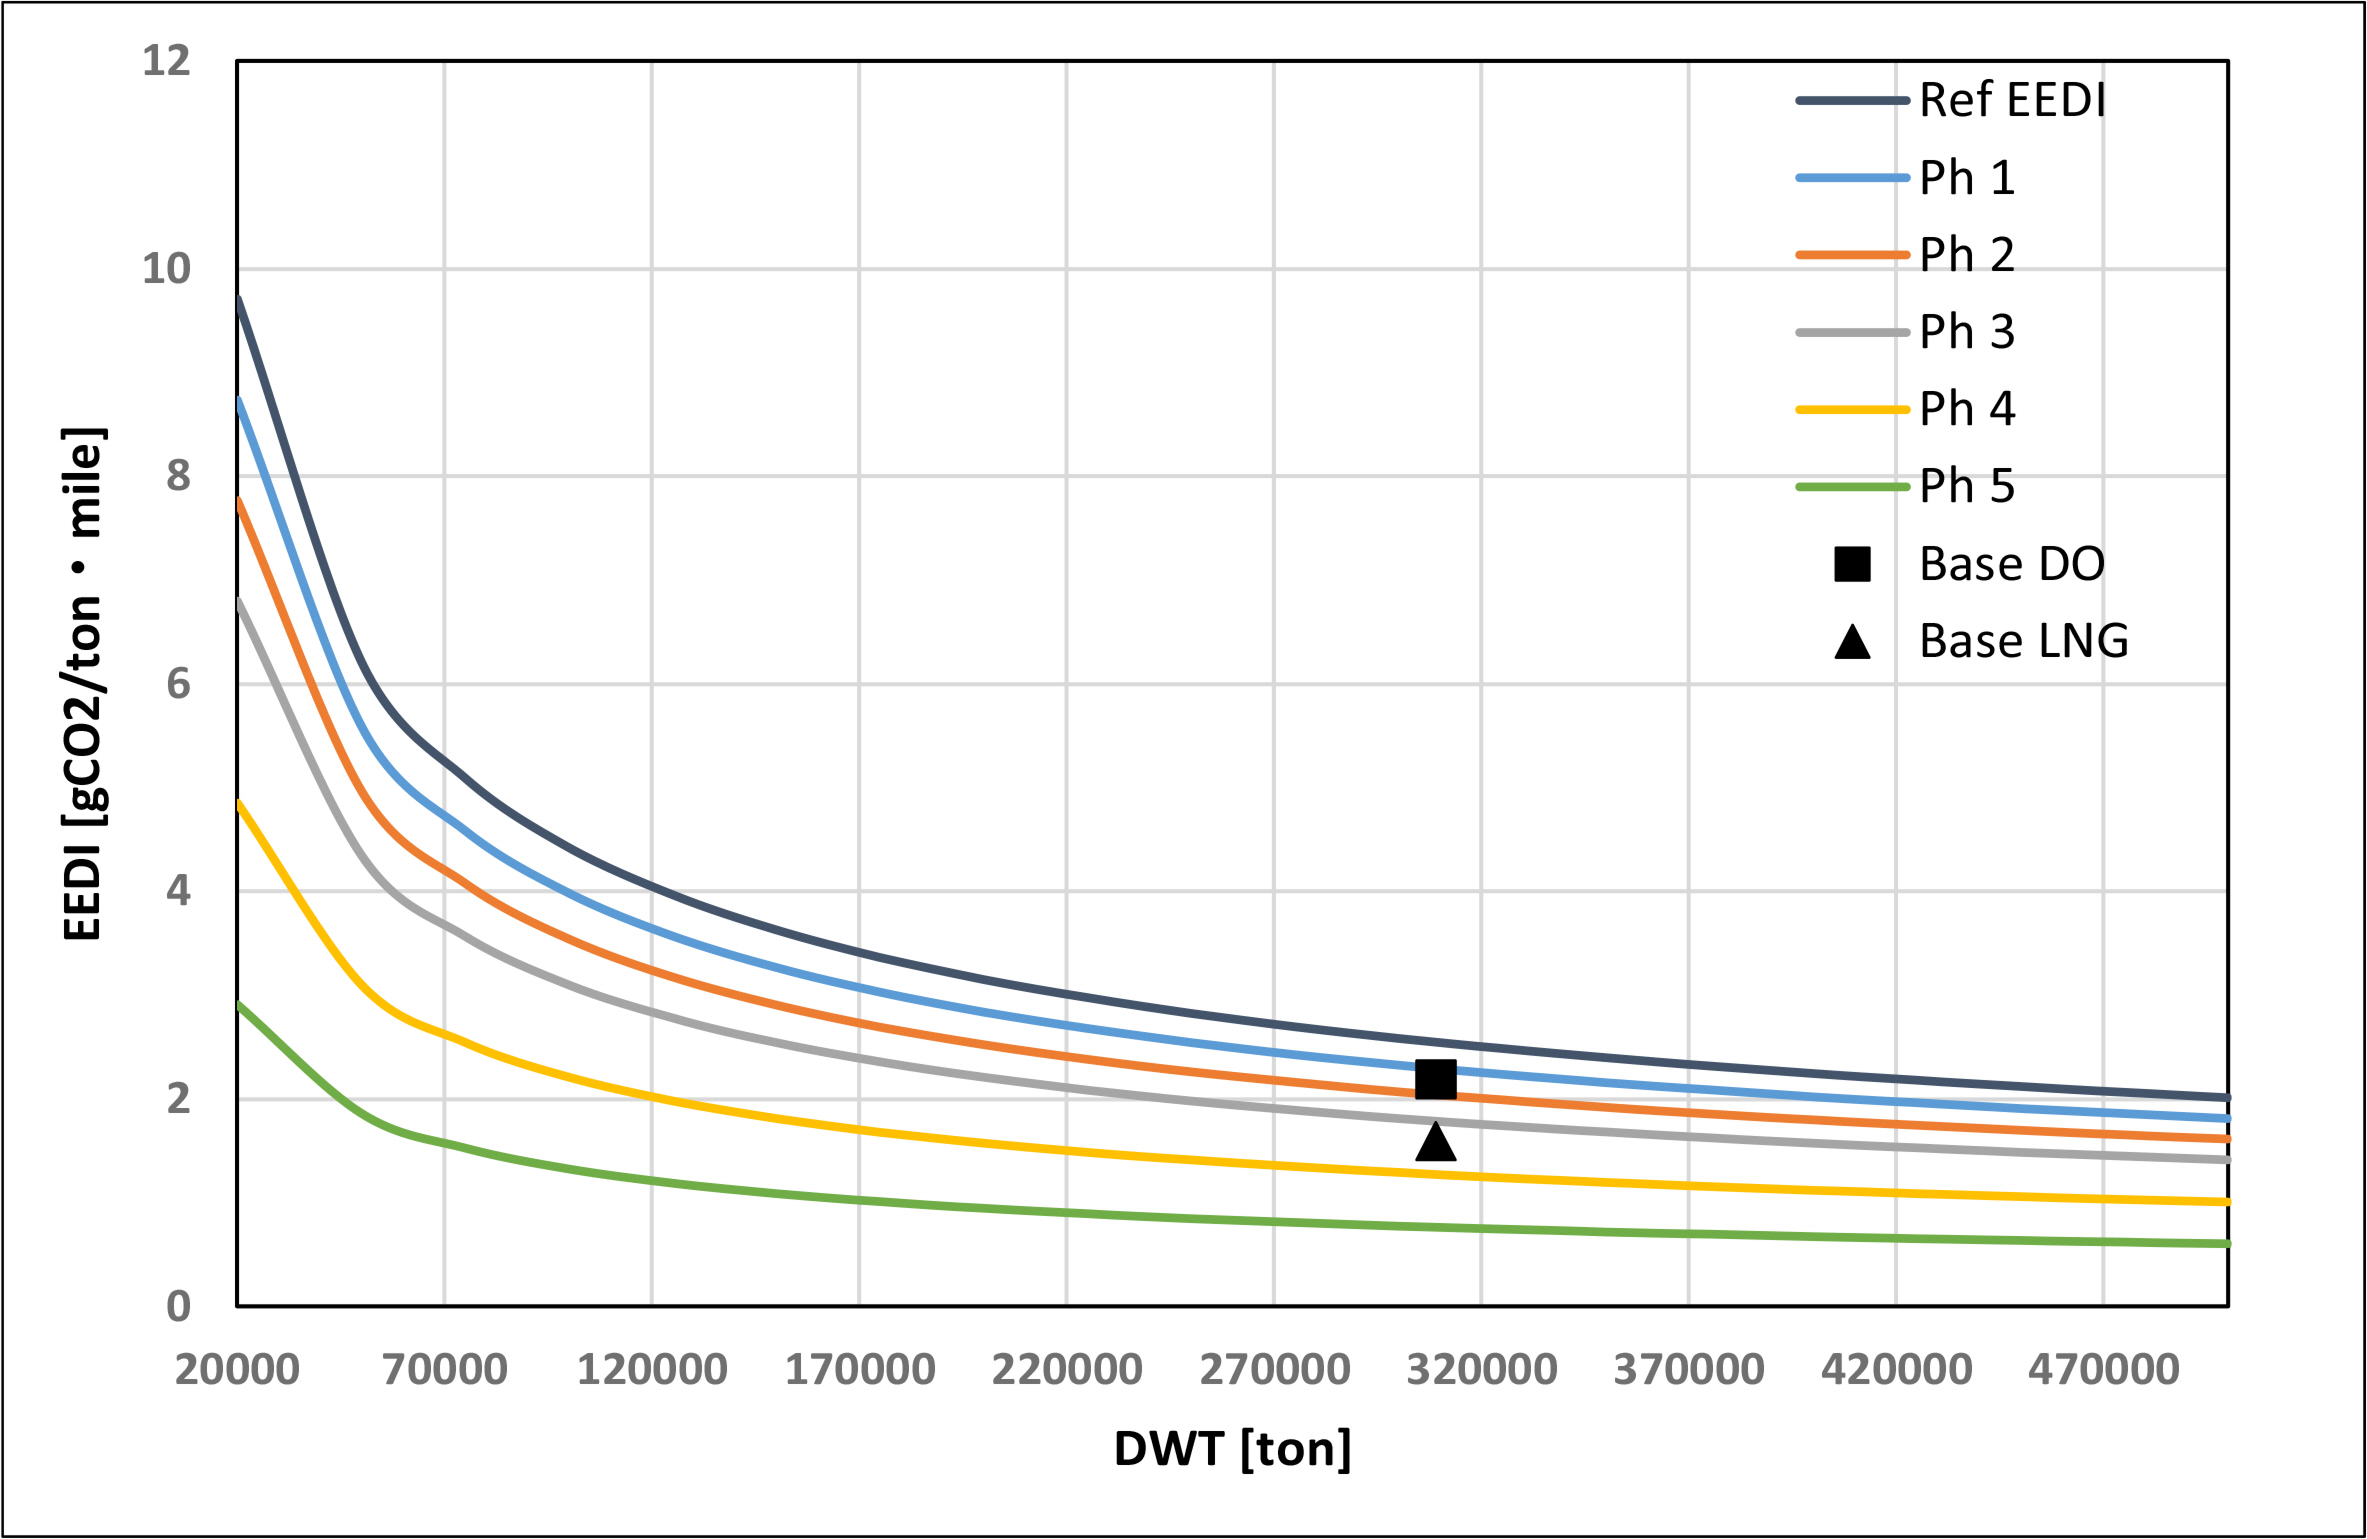
2.3.2 KVLCC2 crude oil tanker

For the KVLCC2 crude oil tanker, the following values from Eq. (11) to (17) can be obtained through the above index calculation process. The unit is gCO2/tㆍnmile.
(11)
Referencelinevalue=1218.80×3090970.488=2.551
(12)
RequiredEEDIPh2=(120100)×2.551=2.041
(13)
RequiredEEDIPh3=(130100)×2.551=1.786
(14)
RequiredEEDIPh4=(150100)×2.551=1.276
(15)
RequiredEEDIPh5=(170100)×2.551=0.7654
(16)
AttainedEEDIDO=(18007.5×3.206×166.25)+(850.25×3.206×196.492)309097×15=2.186
(17)
AttainedEEDILNG=(18007.5×(3.206×3.1+2.75×137.3))+(850.25×(3.206×3.656+2.75×162.482))309097×15=1.589
After calculating the attained EEDI for the diesel and LNG modes in Eq. (16) and (17), respectively, the results were compared with the required EEDI from Eq. (12) to (15) to check if the requirements were fulfilled.
As observed in Fig. 2, only the requirements of Phase 1 can be fulfilled when the crude oil tanker is operated using diesel as fuel. Since the requirements of Phase 2 and above cannot be fulfilled, additional measures are required. Requirements of Phases 1, 2, and 3 can be fulfilled when LNG is used as fuel. Table 5 summarizes the calculation results for the two target vessels.

2.4 Technical Measures for Improving EEDI

If the attained EEDI obtained for the target vessel is higher than the required EEDI, appropriate measures need to be taken to decrease it. Four main measures are available. The easiest method is to reduce the ship speed. In addition, methods for improving fuel efficiency through an improvement in propulsion efficiency by additionally mounting appendages on the hull or by reducing resistance through the modification of the bow shape and OCCS were considered.

2.4.1 Speed reduction

As mentioned above, the container ship can meet up to Phase 3 when operated using diesel as fuel. When the speed is lowered by decreasing 75% of MCR to 50%, the following values in Eq. (18) and (19) can also be obtained. The unit is gCO2/tㆍnmile. SS stands for slow steaming, implying deceleration.
Therefore, the container ship can meet up to Phase 4 (9.697) while operated using diesel by reducing its speed.
For the crude oil tanker, the following values in Eq. (20) and (21) can also be obtained when its speed is lowered to the MCR 50% condition as with the container ship.
As per the above results, the crude oil tanker can meet up to Phase 3 (1.786) when the speed is decreased and diesel fuel is used. If the fuel is switched to LNG, Phase 4 requirements (1.276) can be fulfilled.

2.4.2 ESD installation

According to an ESD-related research report (KIOST, 2016), when LV-Fin (low viscous resistance fin), an energy-saving fin attached the stern, was applied to the KVLCC2 hull form, the effect of reducing delivered horsepower by approximately 1% was verified. When super stream duct (SSD) type ESD was installed, the effect of reducing delivered horsepower by more than 5% was predicted by CFD simulation, and the effect of reducing delivered horsepower by approximately 3% at the reference ship speed was confirmed through a model test. When duct-fin-combined ESD was installed, the effect of reducing delivered horsepower by approximately 7% was estimated, and the 4.1% reduction effect at the reference ship speed was verified through a model test. In addition, when a hybrid counter-rotating propeller (CRP) propulsion system was installed, the effect of reducing delivered horsepower by approximately 10% at the same ship speed was verified. When the propulsion efficiency improved by 5%, and 10% was applied at MCR 75% by referring to the above report, the attained EEDI of the target vessels was calculated by assuming that the effect of remodeling the bow shape is the same as the ESD installation effect.
(18)
AttainedEEDIDOSS=(17175×3.206×159.125)+(1108.75×3.206×204.9)55387×18=9.519
(19)
AttainedEEDILNGSS=(17175×(3.206×3.975+2.75×132.525))+(1108.75×(3.206×3.811+2.75×169.364))55387×18=7.029
(20)
AttainedEEDIDO-SS=(12005×3.206×163.875)+(850.25×3.206×196.492)309097×13=1.703
(21)
AttainedEEDILNG-SS=(12005×(3.206×4.025+2.75×136.525))+(850.25×(3.206×3.656+2.75×162.482))309097×13=1.257
(22)
AttainedEEDIDO-ESD5=(24474.38×3.206×162.5)+(1108.75×3.206×204.9)55387×21=11.589
(23)
AttainedEEDILNGESD5=(24474.38×(3.206×3.0+2.75×134.125))+(1108.25×(3.206×3.811+2.75×169.364))55387×21=8.419
(24)
AttainedEEDIDOESD10=(23186.25×3.206×162.5)+(1108.75×3.206×204.9)55387×21=11.012
(25)
AttainedEEDILNG-ESD10=(23186.25×(3.206×3.0+2.75×134.125))+(1108.25×(3.206×3.811+2.75×169.364))55387×21=8.000
(26)
AttainedEEDIDO-ESD5=(17107.13×3.206×166.25)+(850.25×3.206×196.492)309097×15=2.082
(27)
AttainedEEDILNGESD5=(17107.13×(3.206×3.1+2.75×137.3))+(850.25×(3.206×3.656+2.75×162.482))309097×15=1.514
(28)
AttainedEEDIDOESD10=(16206.75×3.206×166.25)+(850.25×3.206×196.492)309097×15=1.979
(29)
AttainedEEDILNGESD10=(16206.75×(3.206×3.1+2.75×137.3))+(850.25×(3.206×3.656+2.75×162.482))309097×15=1.439
(30)
AttainedEEDIDOSSED=(16316.3×3.206×159.125)+(1108.75×3.206×204.9)55387×18=9.080
(31)
AttainedEEDILNGSSED=(17175×(3.206×3.975+2.75×132.525))+(1108.75×(3.206×3.811+2.75×169.364))55387×18=6.705
(32)
AttainedEEDIDOSSESD=(11404.75×3.206×163.875)+(850.25×3.206×196.492)309097×13=1.624
(33)
AttainedEEDILNGSSESD=(11404.75×(3.206×4.025+2.75×136.525))+(850.25×(3.206×3.656+2.75×162.482))309097×13=1.199
For the container ship, the calculation were conducted as follows; 5% improvement with ESD using diesel and LNG in Eq. (22) and (23) and 10% in Eq. (24) and (25). The EEDI value cannot meet Phase 4 (9.697) with diesel fuel even when the propulsion efficiency is improved by ESD installation, indicating that the fuel must be changed.
The attained EEDI of the crude oil tanker was calculated as follows; 5% in Eq. (26) and (27) and 10% in Eq. (28) and (29) as same order as container's.
Phase 2 (2.041) requirements cannot be fulfilled with diesel fuel even when the propulsion efficiency is improved by 5% through ESD installation, indicating that a 10% efficiency improvement is required.

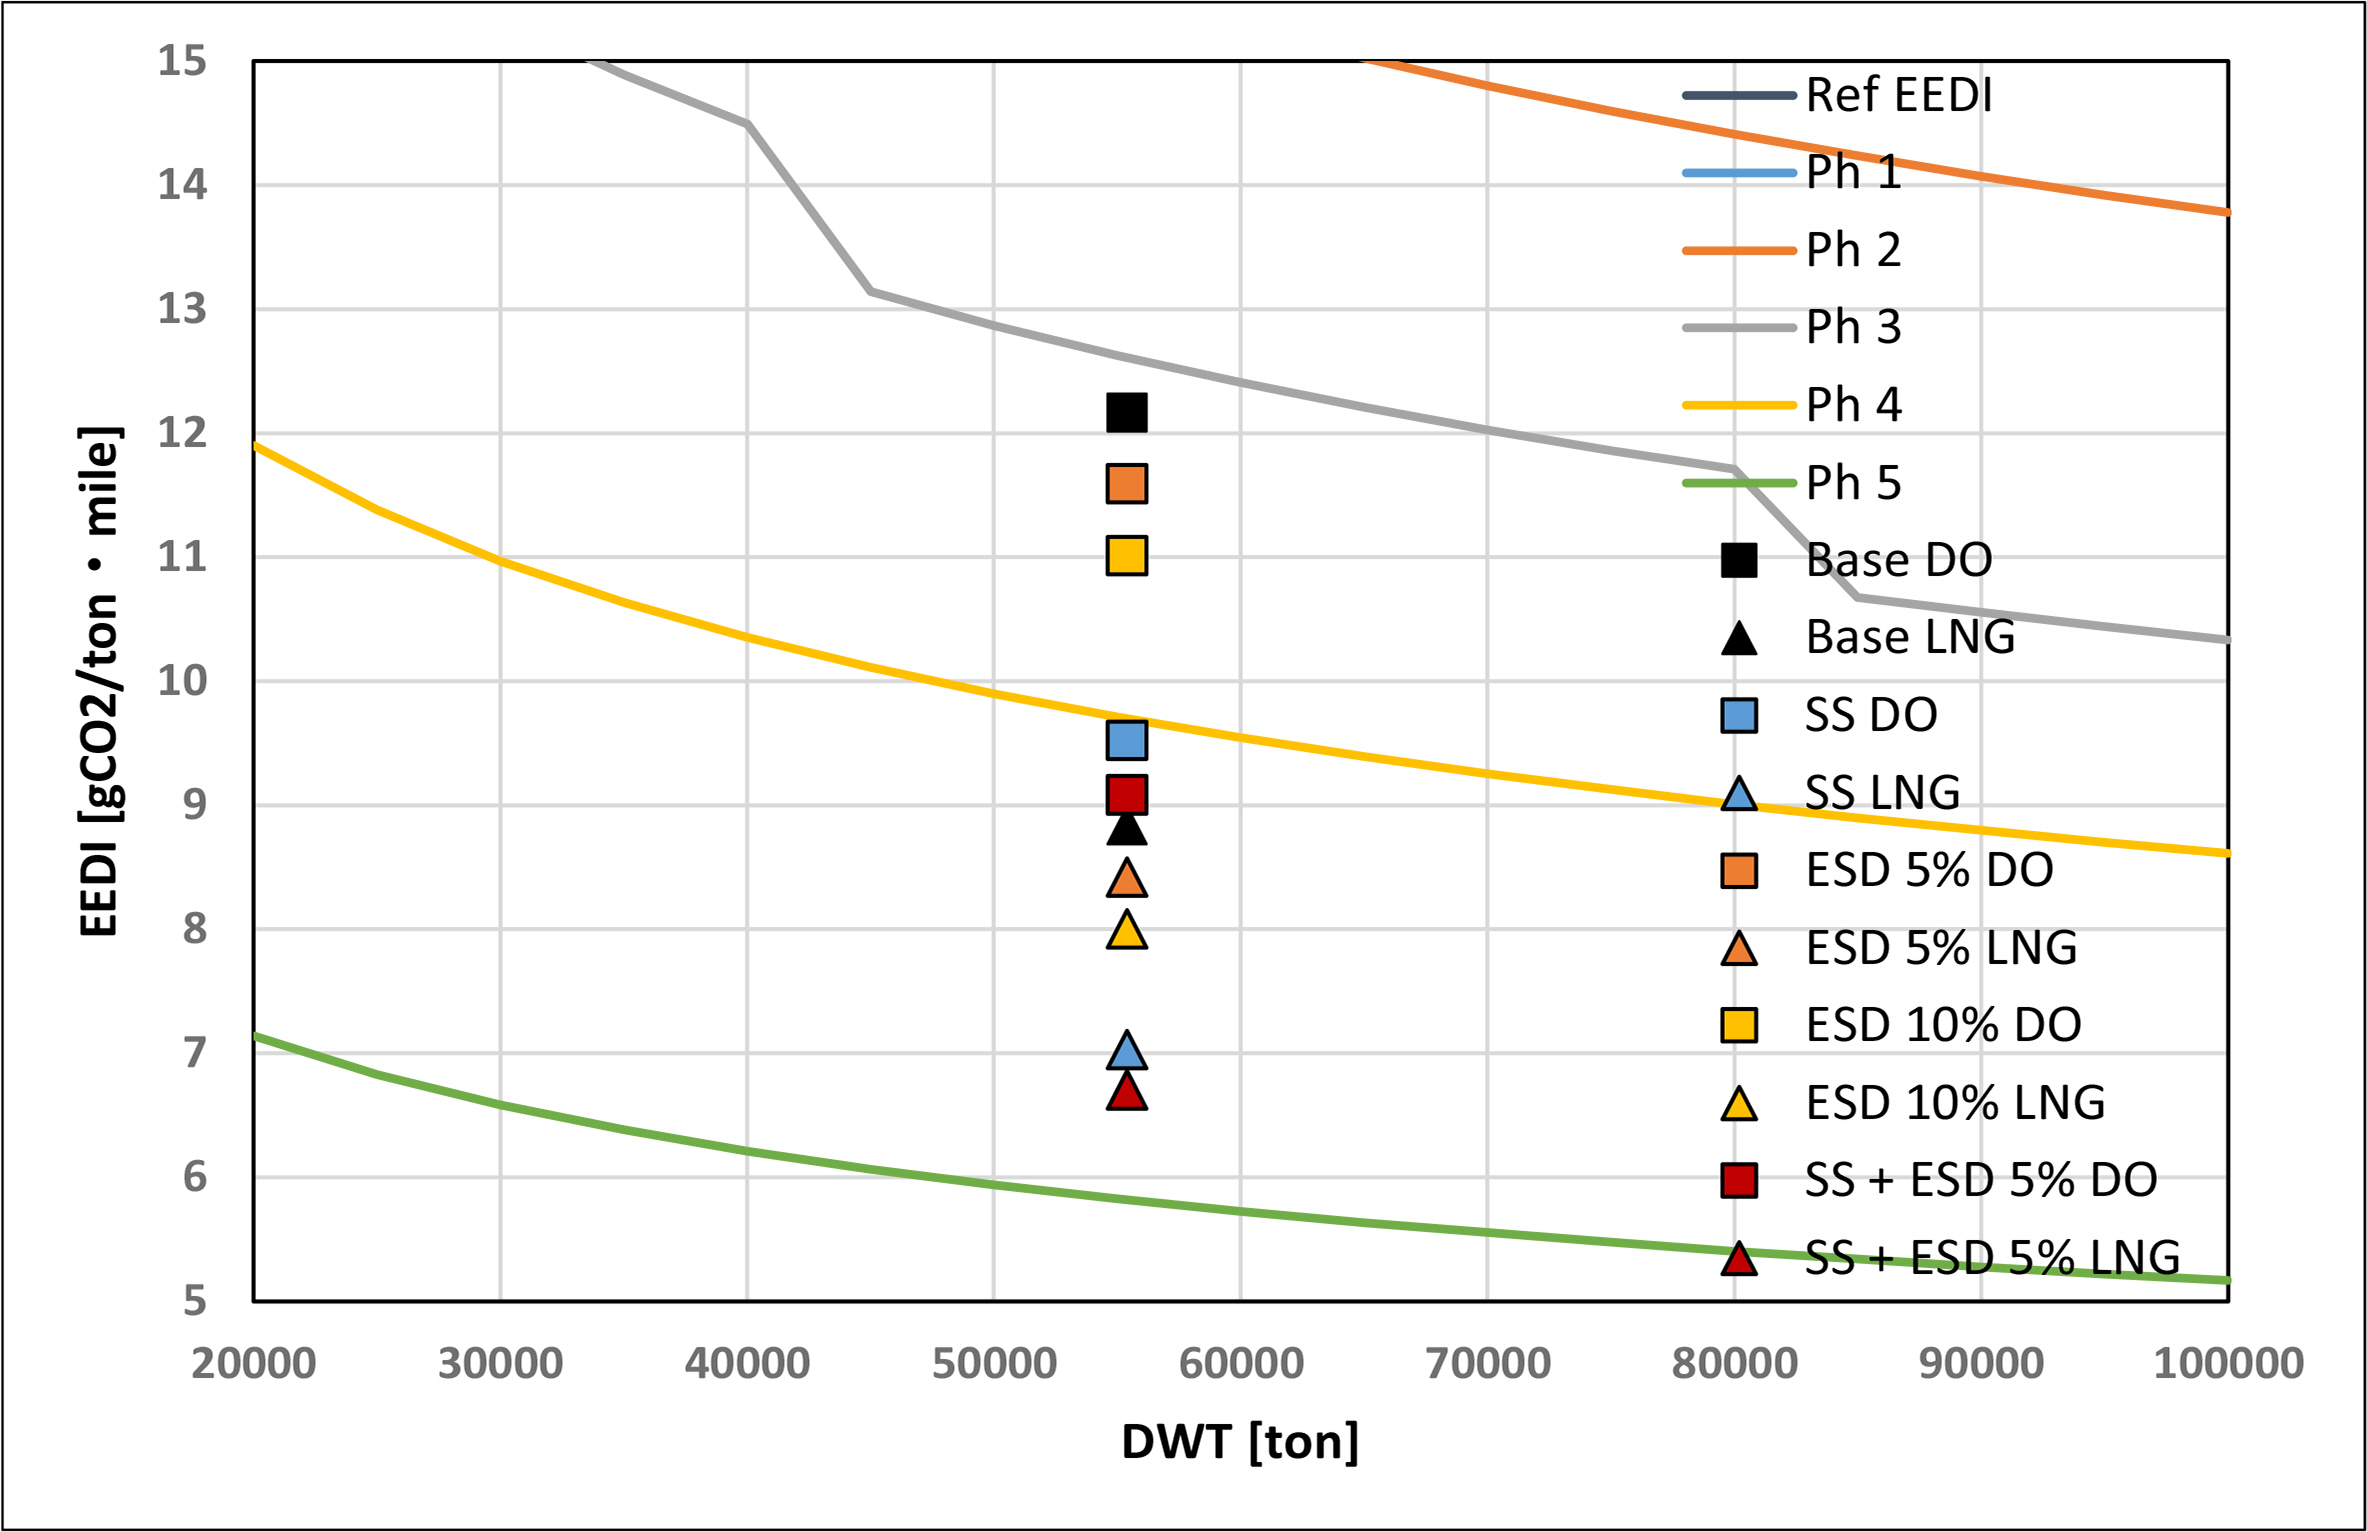
2.4.3 Application of both speed reduction and ESD installation
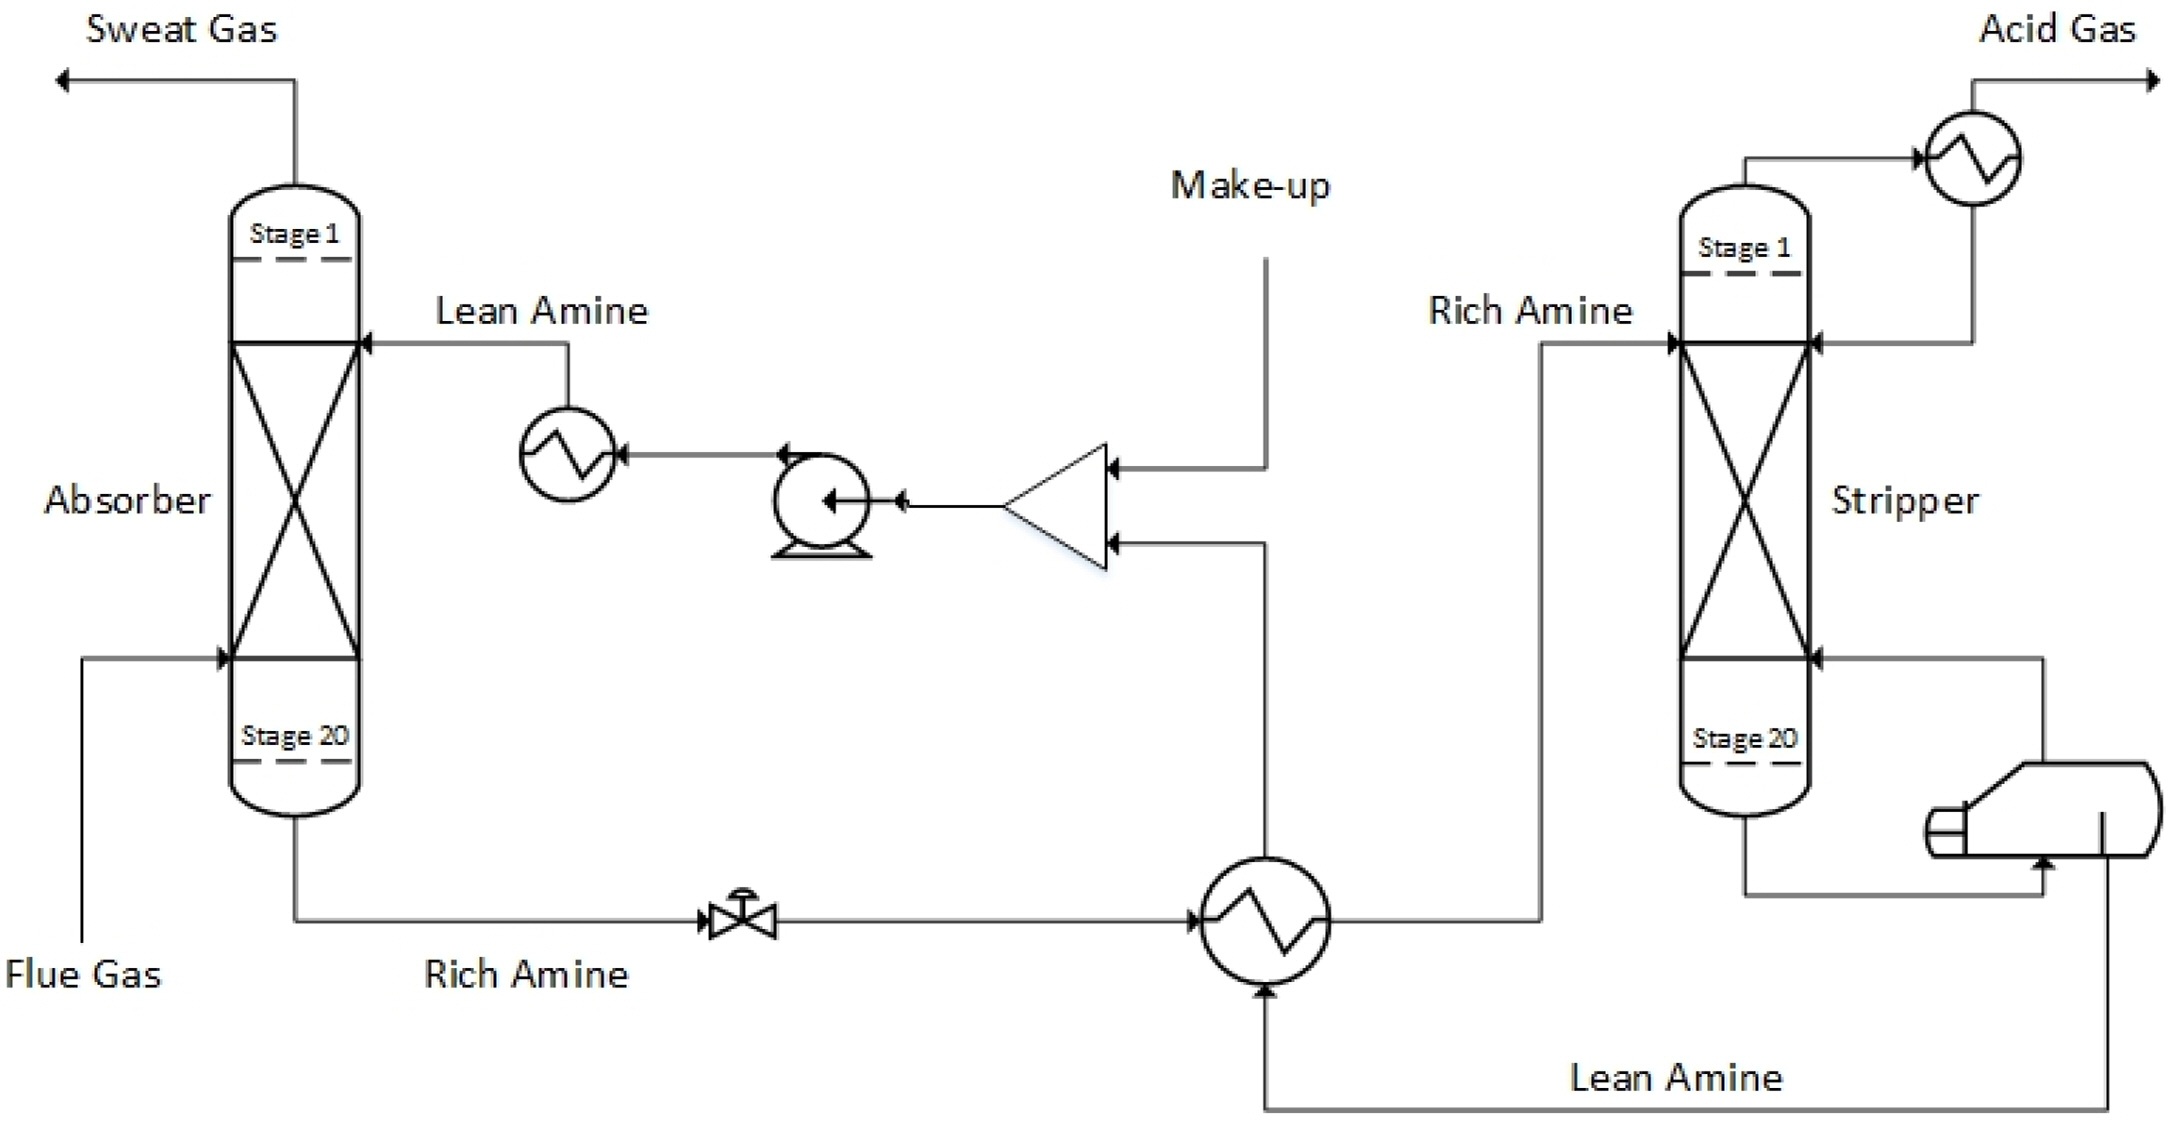
In Section 2.4.1, the index was calculated when the speed of each target vessel was reduced to MCR 50%. In Section 2.4.2, it was calculated by reflecting the ESD installation effect, and whether the results satisfied the regulations was examined. In Section 2.4.3, the index was calculated by reflecting both MCR 50% speed reduction and the 5% propulsion efficiency improvement effect through ESD installation, and the results are as follows; Eq. (30) and (31) are in diesel and LNG usage with slow steaming and ESD at the same time in container and Eq. (32) and (33) in VLCC.
For the container ship, Phase 4 (9.697) requirement is satisfied but Phase 5 (5.818) requirement is not fulfilled owing to the speed reduction effect discussed in Section 2.4.1. Therefore, additional measures are required.
As with the results of Section 2.4.1, the crude oil tanker meets Phase 3 (1.785) with diesel and Phase 4 (1.275) with LNG. It also requires additional measures to meet Phase 5 (0.7654).

2.4.4 OCCS

It was confirmed that up to Phase 4 requirement can be fulfilled through MCR 50% speed reduction and ESC installation. However, additional measures are required to prepare for the Phase 5 regulation. Here, considering the current situation where it is difficult to supply carbon-free fuel, the application of OCCS with high technological maturity was considered. To this end, a CO2 capture process based on an monoethanolamine (MEA) aqueous solution was designed using Aspen Plus v10, a commercial process simulation software program. The process simulation was performed using a rate-based model. The electrolyte non-random two-liquid redlich-kwong (eNRTL-RK) equation of state was used to calculate the activity coefficient, Gibbs energy, enthalpy, and entropy of the MEA solution, and the perturbed-chain statistical associating fluid theory (PC-SAFT) model was used to calculate the fugacity coefficient of the gas phase.
The PC-SAFT model is a SAFT model that Gross and Sadowski developed by applying the Barker–Henderson perturbation theory to a hard-chain reference fluid. This model is represented by the residual Helmholtz free energy term (Ares) generated by interactions among molecules in different forms in a system and is equal to the value obtained by subtracting the Helmholtz free energy of the ideal gas at the same temperature and density (T and ρ). It consists of a hard-sphere-related term, a chain term, a dispersion-related term, and an association-related term (Gross et al., 2001; Diamantonis et al., 2013).
(34)
Ares(T,ρ)NRT=ares(T,ρ)RT=a(T,ρ)RTaideal(T,ρ)RT=aref(T,ρ)RT+adisp(T,ρ)RT=ahs(T,ρ)RT+achain(T,ρ)RT+adisp(T,ρ)RT+aassoc(T,ρ)RT
Fig. 3 shows the process flow diagram of OCCS below.
The process consists of an absorber that selectively removes CO2 from the ship exhaust gas, a stripper that regenerates an aqueous amine solution, and a heat exchanger. The aqueous amine solution (lean amine) absorbs CO2 contained in the exhaust gas while passing through the absorber. In this instance, the aqueous amine solution flows into the top of the tower, and the exhaust gas is introduced into the bottom of the tower to make counter-current contact. The aqueous amine solution that absorbed CO2 (rich amine) is discharged from the top of the tower and introduced into the stripper via the heat exchanger. The aqueous amine solution is heated by the reboiler of the stripper to separate CO2, which is discharged through the top of the stripper. The regenerated aqueous amine solution (lean amine) exchanges heat with rich amine at the heat exchanger and returns to the top of the absorber. Since a high-temperature condition of more than 120 °C is required to regenerate the aqueous amine solution in the stripper, OCCS is regarded as a system with high energy consumption. Therefore, optimal design of the absorber and stripper and the use of a heat exchanger is required to maximize its thermal efficiency. For carbon capture, a commonly used 30wt% MEA solution was used, and the carbon dioxide removal rate was set to 90%. The installation of OCCS may change the hull form or air resistance; however, such changes were not reflected here.
The CO2 reduction rate and CO2 reduction amount required to meet the Phase 5 regulation are shown in Table 6. For the absorber and stripper of OCCS that can be mounted on the container ship and crude oil tanker, the maximum and minimum sizes were calculated. As observed in Table 6, the maximum reduction amount occurred when the container ship used diesel as fuel, and the minimum reduction amount was observed when using LNG as fuel. MCR 50% speed reduction and 5% propulsion efficiency improvement effect through ESD installation for the container ship were considered simultaneously. Therefore, these two cases were set as the maximum and minimum sizes, and the column size was calculated. The following results show that the OCCS column size required for the crude oil tanker is within the maximum-minimum size range.
The diameters and heights of the absorber and stripper required for the above-mentioned CO2 removal were calculated to estimate the approximate footprint of OCCS. As shown in Table 7, an absorber diameter of 3.51 m, an absorber height of 11.28 m, a stripper diameter of 1.52 m, and a stripper height of 9.60 m were calculated as the maximum size. An absorber diameter of 1.22 m, an absorber height of 11.28 m, a stripper diameter of 0.61 m, and a stripper height of 8.84 m were calculated as the minimum size. Due to the nature of the ship structure, the calculation was performed in a direction to decrease the height and increase the diameter. The height of the stripper was confirmed to be low due to the small difference in lean-rich loading. However, the larger difference will lead to a lower flow rate, but the height of the absorber should increase. The removal rate was set to 90%, such that an appropriate height could be determined, and FLEXIPAC HC Structured Packing 250Y (KOCH-GLITSCH) was used as the packing material. In this instance, the energy required by the stripper for regeneration was calculated to be 3.07 GJ/tCO2, indicating that the optimal design to increase thermal efficiency was attained. When the case of using diesel as fuel without considering any technical measures is compared with the case of applying technical measures, such as speed reduction and ESD installation, while using LNG as fuel based on the above results, the diameter decreases by approximately 60% despite no significant difference in height. In other words, various technical measures are required to satisfy EEDI, enabling the compact design of OCCS.

3. Results and Discussion

Main engines were selected considering a container ship and a crude oil tanker under KCS and KVLCC2 hull form conditions. The EEDI calculation results according to the conditions of speed reduction, ESD installation, and both speed reduction and ESD installation and the fuel type are summarized in Table 8. EEDI was calculated to be 26.86% lower on average for LNG compared with diesel. The fuel change from diesel to LNG exhibited the largest reduction in EEDI, followed by decreasing the ship speed among additional measures. The reduction can be increased through ESD installation. To meet the Phase 5 regulation, OCCS can be a potential alternative for the target vessels. Fig. 4 shows the EEDI calculation results obtained from KCS. The EEDI calculation results obtained from KVLCC2 are shown in Fig. 5.

4. Conclusion

Here, ships that applied the target hull forms and their main engines were selected, and the energy efficiency design index (EEDI) was calculated under the conditions of speed reduction, ESD installation, and both speed reduction and ESD installation.
  1. When diesel fuel was used under basic conditions, the KCS hull form fulfilled the requirements of up to Phase 3 while the VLCC2 hull form fulfilled the requirements of Phase 1 in terms of the required EEDI.

  2. When LNG fuel was used under basic conditions, the KCS hull form satisfied the requirements up to Phase 4, and the VLCC2 hull form up to Phase 3.

  3. For each target hull form, the fuel change from diesel to LNG exhibited the largest EEDI reduction effect. Among additional measures, decreasing the ship speed resulted in the largest EEDI reduction effect, except for onboard carbon capture and storage (OCCS).

  4. The EEDI can be secured economically through speed reduction, and the IMO regulations can be satisfied at low cost if speed reduction, ESD, and fuel change can be appropriately applied to the ships according to the regulation phase. It is judged, however, that the installation of OCCS must be considered for the Phase 5 regulation, which is the final goal.

  5. Further research is required in the future to optimize the size and energy consumption of OCCS.

  6. For effective response to carbon emission regulations, complex analysis considering and applying various measures and subsequently examining their effects is required. Moreover, since the analysis method can be more complicated when the characteristics of ships are added, further research needs to be conducted to derive further enhanced improvement measures.

Conflict of Interest

No potential conflict of interest relevant to this article was reported.

Funding

This work received no sepcific grant from any funding agency in the public, commercial, or not-for-profit sectors.

Fig. 1.
Reference EEDI and Required EEDI of KCS container ship
ksoe-2023-001f1.jpg
Fig. 2.
Reference EEDI and Required EEDI of KVLCC2 crude oil tanker
ksoe-2023-001f2.jpg
Fig. 3.
Process flow diagram of on-board CO2 capture process adopting the MEA (monoethanolamine) solution
ksoe-2023-001f3.jpg
Fig. 4.
Result of required EEDI and attained EEDI with actions taken on the KCS container ship
ksoe-2023-001f4.jpg
Fig. 5.
Result of required EEDI and attained EEDI with actions taken on the KVLCC2 crude oil tanker
ksoe-2023-001f5.jpg
Table 1.
X values of each phase for the required EEDI calculation (DWT, Deadweight) (IMO, 2011)
Type Size (DWT) Phase 0 (2013.01.01. −2014.12.31) Phase 1 (2015.01.01. −2019.12.31.) Phase 2 (2020.01.01. −2024.12.31.) Phase 3 (2025.01.01.–) Phase 4 Phase 5
Bulk carrier 20,000 and above 10,000–20,000 0 10 20 30 50 70
n/a 0–101) 0–201) 0–301)
Gas carrier 10,000 and above 2,000–10,000 0 10 20 30
n/a 0–101) 0–201) 0–301)
Tanker 20,000 and above 4,000–20,000 0 10 20 30
n/a 0–101) 0–201) 0–301)
Container ship 15,000 and above 10,000–15,000 0 10 20 30–50
n/a 0–101) 0–201) 0–301)
General cargo ship 15,000 and above 3,000–15,000 0 10 15 30
n/a 0–101) 0–151) 0–301)
Refrigerated cargo carrier 5,000 and above 3,000–5,000 0 10 15 30
n/a 0–101) 0–151) 0–301)
Combination carrier 20,000 and above 4,000–20,000 0 10 15 30
n/a 0–101) 0–151) 0–301)

1) Obtaining X value by linear interpolation according to the size of the ship.

Table 2.
X values of phase 3 of different container ship’s size (IMO, 2020)
Size (DWT) Phase 3
10,000–15,000 15–301)
15,000–40,000 30
40,000–80,000 35
80,000–120,000 40
120,000–200,000 45
over 200,000 50

1) Obtaining X value by linear interpolation according to the size of the ship.

Table 3.
Reference line calculation parameters (IMO, 2011)
Ship type defined in Regulation 2 a b c
2.25 Bulk carrier 961.79 DWT 0.477
2.26 Gas carrier 1120.00 DWT 0.456
2.27 Tanker 1218.80 DWT 0.488
2.28 Container ship 174.22 DWT 0.201
2.29 General cargo ship 107.48 DWT 0.216
2.30 Refrigerated cargo carrier 227.01 DWT 0.244
2.31 Combination carrier 1219.00 DWT 0.488
Table 4.
Carbon content and CF values of different fuel types (IMO, 2014)
Fuel type Reference Carbon content CF
1 Diesel/Gas oil ISO 8217 Grades DMX1) thorugh DMB1) 0.8744 3.206
2 Light fuel oil (LFO) ISO 8217 Grades RMA1) thorugh RMD1) 0.8594 3.151
3 Heavy fuel oil (HFO) ISO 8217 Grades RME1) thorugh RMK1) 0.8493 3.114
4 Liquefied petroleum gas (LPG) Propane 0.8182 3.000
Butane 0.8264 3.030
5 Liquefied natural gas (LNG) 0.7500 2.750
6 Methanol 0.3750 1.375
7 Ethanol 0.5217 1.913

1) The category of fuel, consisting of three letters: the first letter of this category is always the family letter (D for distillate or R for residual); the second letter, M, designates the application “Marine”; the third letter, X, A, B, C, …, K, which indicates the particular properties in the product specification (ISO 8217)

Table 5.
EEDI calculation result
Calculated EEDI KCS container ship KVLCC2 crude oil carrier
Reference line value 19.39 2.55
Required EEDI Phase 2 15.52 2.04
Required EEDI Phase 3 12.61 1.79
Required EEDI Phase 4 9.69 1.28
Required EEDI Phase 5 5.82 0.77
Attained EEDI DO 12.17 2.19
Attained EEDI LNG 8.84 1.59
Table 6.
CO2 emissions and reduction target
Case CO2 emissions (kg/h) CO2 reduction rate (%) CO2 reduction amount (kg/h)
Container base DO 14150.60 52.2 7386.61
LNG + SS + ESD 6684.66 13.3 889.06
VLCC Base DO 10135.29 65.0 6587.94
LNG + SS + ESD 4817.89 36.2 1744.08
Table 7.
Result of CCS column size
Size Absorber diameter (m) Absober height (m) Stripper diameter (m) Stripper height (m)
Max. size 3.51 11.28 1.52 9.60
Min. size 1.22 0.61 8.84
Table 8.
Comparison of EEDI calculation result
Case KCS KVLCC2

DO LNG DO LNG
Base 12.166 8.838 2.186 1.589
SS (Slow steaming) 9.519 7.029 1.703 1.257
ESD (DHP 5%) 11.589 8.419 2.082 1.514
ESD (DHP 10%) 11.012 8.000 1.979 1.439
SS + ESD (DHP 5%) 9.08 6.705 1.624 1.199

References

Choi, J. S., & Rho, B. S. (2011). A Study on the Energy Efficiency Operational Indicator for CO2 Reduction from Ships. Journal of Advanced Marine Engineering and Technology, 35(8), 1035-1040.
crossref
Diamantonis, N. I., Boulougouris, G. C., Mansoor, E., Tsangaris, D. M., & Economou, I. G. (2013). Evaluation of cubic, SAFT, and PC-SAFT equations of state for the vapor–liquid equilibrium modeling of CO2 mixtures with other gases. Industrial & Engineering Chemistry Research 2013, 52(10), 3933-3942. https://doi.org/10.1021/ie303248q
crossref
Gross, J., & Sadowski, G. (2001). Perturbed-Chain SAFT:  An equation of state based on perturbation theory for chain molecules. Industrial & Engineering Chemistry Research 2001, 40(4), 1244-1260. https://doi.org/10.1021/ie0003887
crossref
International Maritime Organization (IMO). (2022). Reduction of GHG emissions from ships; Proposal for including carbon capture technologies in the IMO regulatory framework to reduce GHG emissions from ships. MEPC 79/7/4.

International Maritime Organization. (2011). Amendments to the ANNEX of the protocol of 1997 to amend the international convention for the prevention of pollution from ships, 1973 as modified by the protocol of 1978 relating thereto (Resolution MEPC, 203(62.

International Maritime Organization. (2014). 2014 Guidelines on the method of calculation of the attained Energy Efficiency Design Index(EEDI) for new ships (Resolution MEPC.245(66)).

International Maritime Organization. (2018). 2018 Guidelines on the method of calculation of the attained Energy Efficiency Design Index(EEDI) for new ships (Resolution MEPC.308(73)).

International Maritime Organization. (2020). Amendments to the ANNEX of the protocol of 1997 to amend the international convention for the prevention of pollution from ships, 1973 as modified by the protocol of 1978 relating thereto (Resolution MEPC.324(75)).

Jung, J. Y., & Seo, Y. T. (2022). Onboard CO2 capture process design using rigorous rate-based model. Journal of Ocean Engineering and Technology, 36(3), 168-180. https://doi.org/10.26748/KSOE.2022.006
crossref
Jung, K H. (2014). Study of various effects and CO2 absorption on EEDI (Energy efficiency design index) in merchant ships . [Master’s Thesis, Pohang University of Science and Technology; https://postech-primo.hosted.exlibrisgroup.com/permalink/f/qubcit/82POSTECH_INST2190081700003286

Kim, J. H., Choi, J. E., Choi, B. J., Chung, S. H., & Seo, H. W. (2015). Development of energy-saving devices for a full slow-speed ship through improving propulsion performance. International Journal of Naval Architecture and Ocean Engineering, 7(2), 390-398. https://doi.org/10.1515/ijnaoe-2015-0027
crossref
Korea Institute of Ocean Science & Technology (KIOST). (2016). 에너지 절감을 위한 선박 저항감소 및 추진성능 향상 핵심기술 개발. [Development of core technologies for reducing ship resistance and improving propulsion performance for energy saving]. https://scienceon.kisti.re.kr/srch/selectPORSrchReport.do?cn=TRKO201800039492

MAN Energy Solutions. (2019). Marine engine programme 2018, 2nd ed..

Park, G., & Cho, K. (2017). A study on the change of EEOI before and after modifying bulbous at the large container ship adopting low speed operation. Journal of Advanced Marine Engineering and Technology, 41(1), 15-20.
crossref
Shin, H. J., Lee, K. H., Han, M. R., Lee, C. Y., & Shin, S. C. (2013). Pre-swirl duct of fuel oil saving device design and analysis for ship. Journal of the Society of Naval Architects of Korea, 50(3), 145-152. https://doi.org/10.3744/SNAK.2013.50.3.145
crossref
Song, H. J., Kim, M. C., Lee, W. J., Lee, K. W., & Kim, J. H. (2015). Development of the new energy saving device for the reduction of fuel of 176k bulk carrier. Journal of the Society of Naval Architects of Korea, 52(6), 419-427. https://doi.org/10.3744/SNAK.2015.52.6.419
crossref


ABOUT
BROWSE ARTICLES
ARTICLE CATEGORY

Browse all articles >

PUBLICATION ETHICS
FOR CONTRIBUTORS
Editorial Office
President Office BD Rm. 1302, 13 Jungang-daero 180beon-gil, Dong-gu, Busan 48821, Republic of Korea
Tel: +82-51-759-0656    Fax: +82-51-759-0656    E-mail: ksoehj@ksoe.or.kr                

Copyright © 2024 by The Korean Society of Ocean Engineers.

Developed in M2PI

Close layer
prev next