Sensitivity Study on SCR Design for Spread-Moored FPSO in West Africa
Article information
Abstract
It is generally acknowledged that the Steel Catenary Riser (SCR) is the most cost-effective riser type for deep-water offshore fields among various risers, including the SCR, flexible riser, and hybrid riser. However, in West Africa, the SCR type may not be suitable for FPSO systems because the large vertical motion of the floater brings about a considerable riser dynamic response. In this paper, an SCR system is designed for the FPSO in the West African field, where the use of a hybrid riser has been preferred. The proposed SCR configuration fulfills the design criteria of the API, such as the strength check and fatigue life. Moreover, a sensitivity analysis is also carried out to improve the certainty in the SCR design of a deep-water FPSO. The parameters affecting the strength and fatigue performance of the SCR are considered.
1. Introduction
The increase in oil & gas field development in West African deep-waters has caused a quick evolution of the complexity and variety of production risers from the seabed to an offshore floating structure. The main design criteria for riser system are their strength and fatigue life, which are regarded to be the most difficult aspects of developing deep-water systems. To conform to the required design conditions, many kinds of risers are available, including steel catenary riser(SCR), flexible riser and hybrid riser. The advantages of using SCR are that it has a simple design and low cost. However, the dynamic response of the riser is sensitive to floater motion and can be susceptible to insufficient fatigue life and strength. On the other hands, hybrid riser can reduce the dynamic responses of the riser and can lead to a remarkable performance in deep-water fields even though it is much more expensive than SCR. That is why hybrid riser has been selected for almost all floating production storage and offloading(FPSO) in West Africa. From this point of view, design and sensitivity analysis of SCR which is suitable for FPSO in West Africa need to be developed in order to reduce the high costs and to address the difficulty in fabricating and installing a hybrid riser.
A conventional production riser system has been extensively studied for use in deep waters. Xia, Das and Karunakaran presented a parametric design study of SCR system for a semi-submersible or FPSO in the northern North Sea(Xia et al., 2008). Yang and Li proposed an effective optimization strategy for the design of a deep-water riser under fatigue life constraints(Yang et al., 2011). Iranopur and Taheri conducted a series of experimental tests for fatigue life estimation of risers(Iranopur et al., 2008). Yang and Li presented the fatigue sensitivity analysis for deepwater lazy wave steel catenary riser(Yang and Li, 2011). Yang and Zheng studied design of steel catenary riser under dynamic environmental loads using a reliability based design optimization methodology(Yang and Zheng., 2011). Larsen and Hanson performed optimal design of catenary riser with respect to criterial function, design requirements in terms of maximum allowable stress and buckling capacity(Larsen and Hanson, 1999). Kim evaluated the general and detailed structural performances of SCR and lazy-wave steel catenary riser(LWSCR) under same storm and floater conditions(Kim and Kim, 2015). Wang and Duan proposed a nonlinear model for deep water lazy-wave steel catenary riser configuration considering effect of pipe-soil interaction, current and internal flow(Wang and Duan, 2015). Bai and Huang established a mathematical model of steel catenary riser considering the seabed and the influence of the soil-pipe interaction forces(Bai et al., 2015). McGrail and Lim performed a technical appraisal of hybrid riser and SCR in deep water applications and established the technical design approach(McGrail and Lim, 2004). Yue, Campbell and Walters studied the improvement in the strength and fatigue performance of dynamic vessel applications with various kinds of configurations(Yue et al., 2010). Royer and Power evaluated riser concepts for high-motion vessels(FPSO and Semi-submersible) operating in waters at up to 10,000 feet in the Gulf of Mexico(Royer and Power, 2014).
In order to apply SCR to spread-moored FPSO in West African deep waters, the design of the riser must be conducted for a water depth of 1400 m. A strength check is conducted to evaluate the response of the SCR to all possible loading conditions. The fatigue performance is also assessed to meet a design fatigue life of 30 years. The wave fatigue analysis and the vortex-induced vibration fatigue analysis were conducted. Finally, the results of a parametric study were presented to obtain a better understanding of the SCR behavior and to find the major design parameters that could be used to optimize the riser configuration. Sensitivity analyses were carried out for the strength and wave fatigue to determine the influence of the drag coefficient, seabed stiffness, flex-joint stiffness and insulation thickness in producing the SCR dynamic response and determining the fatigue life.
2. Design Data and Criteria
The target field for the FPSO was in West Africa, and the general field layout is shown in Fig. 1. The riser in this paper consists of an oil production SCR with an outer diameter of 10.75 inches, and the line pipe properties proposed for the SCR are presented in Table 1.
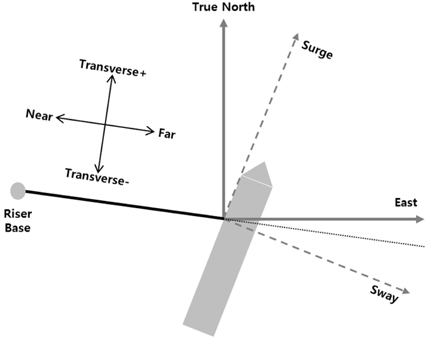
FPSO Offset Direction Relative SCR Axis
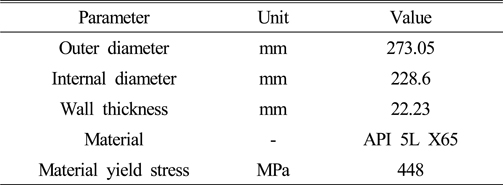
SCR Line Pipe Properties
The environmental data that are used in this paper are a typical offshore environment condition in West Africa, and the water depth for the design is set to 1400 m. The environmental details, including the wave, current and soil stiffness in this study are provided in Table 2. The wave data is for three wave partitions - main swell, secondary swell and wind-sea. The Ochi-Hubble wave spectra shall be used as applicable to generate irregular waves. 41 design sea states are considered for wave fatigue analysis, and 424 current profiles were applied for vortex-induced vibration fatigue analysis. A generic FPSO facility with a spread mooring system was considered in this paper, and the key particulars of the FPSO are summarized in Table 3.
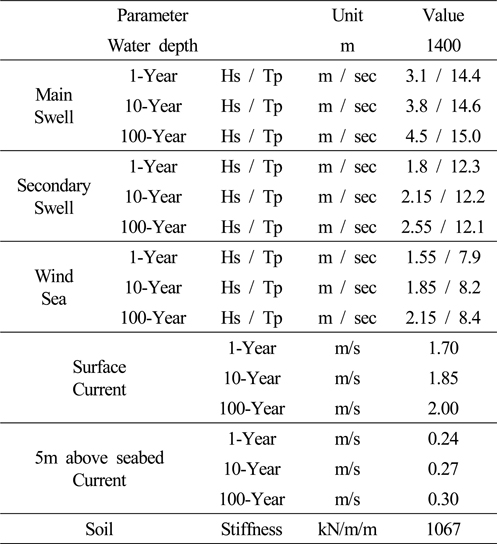
Environmental data
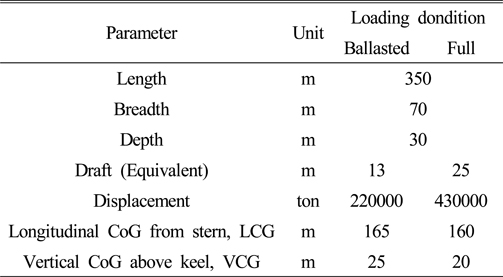
Spread-moored FPSO dimensions
The design criteria for the riser are determined according to the design codes made by API. The minimum pipe wall thickness required for the SCR should be satisfied according to the burst condition due to internal pressure and collapse conditions due to external pressure according to API-RP-2RD and API-RP-1111. To check the strength of the riser, the allowable von Mises stress was calculated according to the API-RP-2RD. The allowable stress was defined by the design case factor(Cf), allowable stress factor(Ca) and minimum specified material yield strength(σy) with the following relationship.
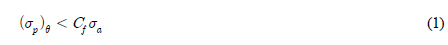
where σa is the basic allowable combined stress (Caσy); Ca is the allowable stress factor with a value of 2/3; σy is the material minimum strength; Cf is the design case factor in Table 4; and (σp)e is the extreme von Mises stress in the pipe.
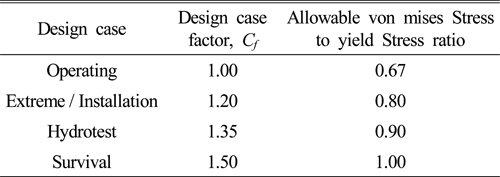
Allowable stress criteria
For a plain round pipe, where transverse shear and torsion are negligible, the three principle stress components of the primary membrane stress(average stress across pipe wall) are σpr, σpθ and σpz, where r, θ and z refer to the radial, hoop and axial stress.
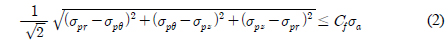
These von Mises equivalent stresses should be less than the allowable stresses defined in Table 4.
For this study, the design life for the SCR is 30 years, and the basic fatigue information is given by the S-N curves that are used to evaluate the riser design life, as shown below.
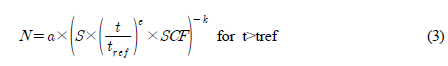
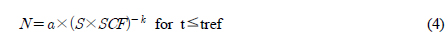
where S is the stress range; N is the allowable number of cycles; a and k are the parameters defining the curves; tref is the reference thickness; and e is the thickness exponent.
The S-N curve that is to be used in the fatigue analysis is the DNV E class design curve. The DNV D and F3 class design curves are also considered to conduct a sensitivity check. The Palmgren-Miner rule was applied to calculate the fatigue damage after a dynamic analysis under a long-term sea-state condition.
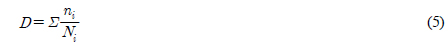
where ni is the number of stress range occurrences; and Ni is the number of stress cycles obtained from the S-N curve for failure.
A stress concentration factor of 1.2 was applied to account for the stress amplification due to welding misalignment. A safety factor of 10 is considered based on API-RP-2RD, and the fatigue life, accounting for damage from waves and vortex-induced vibration, should exceed the required design life.
3. Analysis Methodology
A non-linear time domain analysis program, OrcaFlex(version 9.8c), was used to perform the riser strength and fatigue analyses. A strength analysis was conducted to determine the extreme response of the SCR under specific loading conditions during all stages of the SCR service life. The load case matrix was developed according to the API-RP-2RD, as in Table 5. The analysis includes a range of load cases that are suitable to cover all of the loading conditions predicted for the SCR. The maximum von Mises stress, maximum flex-joint rotation angle and effective tension at critical region were evaluated for each of the load cases. The SCR shall meet the design acceptance detailed in Table 4 for all load cases.
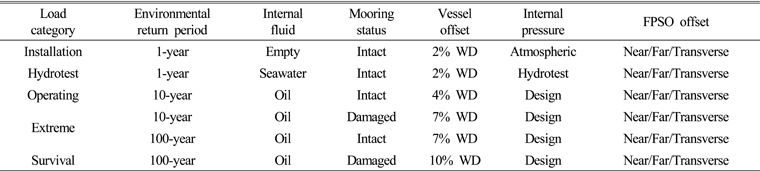
Strength Analysis Load Case Matrix
First and second-order fatigue analyses are conducted to calculate the fatigue damage that is induced by the wave frequency and low frequency motion of the FPSO. The first order vessel motions are represented using the vessel RAOs while the second order vessel motions are expressed as harmonic motions based on the low frequency surge and sway amplitudes and drifts periods associated with each sea-state. The fatigue damage is determined using a rain-flow counting method, and as can be seen in Table 6, the 41 fatigue cases are also to be considered. A vortex-induced vibration (VIV) analysis is performed using SHEAR7 to determine the current-induced fatigue damage on the SCR. The VIV analysis is conducted for currents flowing in the in-line and transverse direction relative to the riser plane, and the total fatigue damage due to VIV is calculated by the sum of the damage factored for each of the current profiles.

Condensed Sea-state Scatter Diagram
The combined fatigue damage, including VIV and wave fatigue damages, is given by adding the damage along the riser length using the following equation.

where, Dtotal is the factored combined fatigue damage; Dwave is the un-factored fatigue damage due to FPSO motions; DVIV is the un-factored fatigue damage due to VIV; FoS is the fatigue safety factor applied by 10.
The combined fatigue life should exceed a design fatigue life of 30 years.
4. Riser Configuration
The SCR configuration that was proposed for this study is described in Fig. 2 with respect to the FPSO offset.
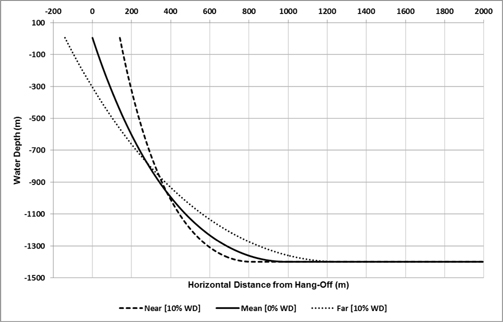
SCR Configuration with respect to FPSO offset
5. Strength Analysis
The objectives of the strength assessment are to determine the following:
Von Mises stresses with operating, extreme/installation, survival and hydrotest design criteria
Vessel/riser interface loads including effective tensions and flex-joint rotation angles
Dynamic tension variation
The results of the dynamic analysis are presented in this section. The analysis is performed for installation, hydrotest, operating, extreme and survival conditions. The maximum von Mises stress utilization and effective tension along the arc-length for the critical load cases are shown in Fig. 3, Fig. 4, and Fig. 5, respectively. The maximum flex-joint angle is 8.3 degrees in the survival condition and it is less than the typical flex-joint rotational capacity of +/−18 degrees, as shown in Fig. 6. The stress utilization is 0.80, and it occurs at the top of the SCR. The maximum effective tension at the top of the SCR is 2999 kN, and compression is not observed along the length of the SCR for all design cases. The minimum effective tension at the touch-down zone is 64.6 kN and remains as a positive tension.
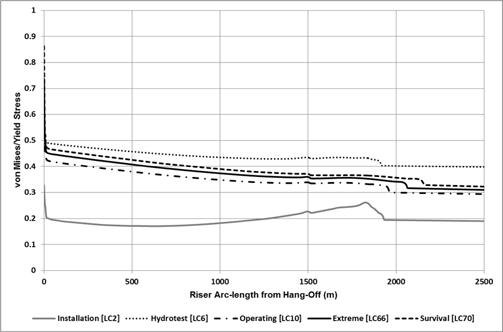
SCR Dynamic Stress Distribution along Arc-length
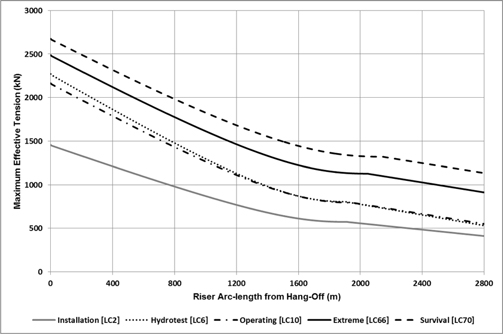
SCR Dynamic Maximum Tension along Arc-length
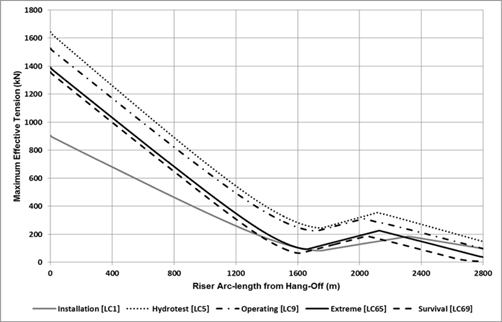
SCR Dynamic Minimum Tension along Arc-length
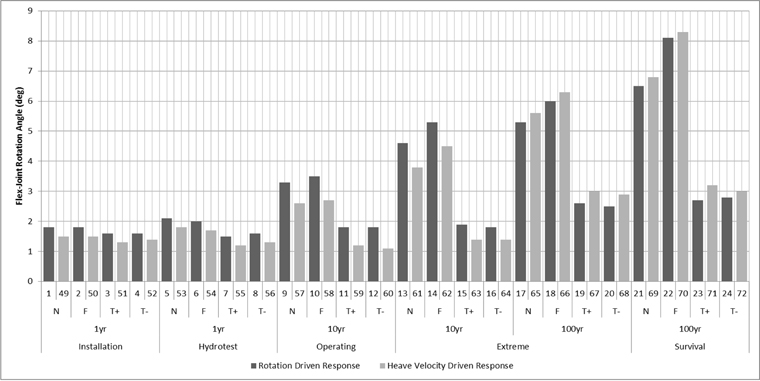
Maximum flex-joint rotation angle for dynamic analysis note: Near(N), Far(F), T+(Transverse+), T−(Transverse−)
6. Fatigue Analysis
The objective of the wave fatigue analysis is to evaluate the fatigue damage of the SCR mainly caused by the vessel motions. The wave fatigue response of the SCR due to the first-order and second-order vessel motions is assessed by taking 41 sea-states into consideration. The fatigue life is calculated using the DNV-E class design curve with a SCF of 1.2 as a base case, which represents the girth welds along the SCR. A parametric analysis with the upper DNV-D and lower DNV-F3 class design curves are also carried out to check the influence of the fatigue curve selection on the prediction of the fatigue life.
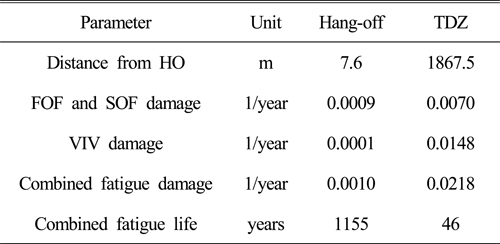
Table 7 provides the minimum fatigue lives at the hang-off point of the riser and touch-down zone for the different fatigue curves. The fatigue life distribution along the SCR arc-length is described in Fig. 7. The fatigue lives that are presented include a safety factor of 10. A minimum wave fatigue life in the SCR is 143 years and it is found at the touch-down point region. The fatigue life at the hang-off is 1155 years which is less critical than that at the touch-down zone. On the other hand, the fatigue life considering the DNV-F3 class design curve is too conservative to meet the design life.

Fatigue analysis results
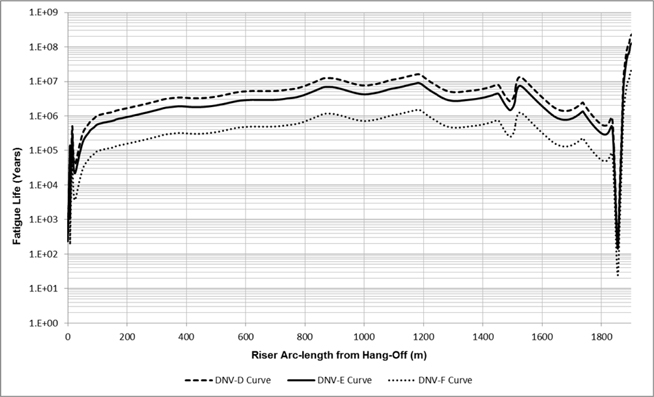
Wave fatigue life along arc-length
The purposes of the VIV fatigue analysis are to optimize the strake length for the SCR and to estimate the VIV fatigue life along the SCR. The analysis is performed by using 424 long-term characteristic current profiles, natural frequencies, modal curvatures and mode shapes. The minimum fatigue lives are presented in Table 7. The results show that the minimum fatigue life occurs at the touch-down zone, at a distance of approximately 1868m from the hang-off location for the in-plane mode VIV. The minimum VIV fatigue life is determined to be 68 years according to the DNV-E class design curve.
The combined fatigue lives of the SCR due to the wave motions and vortex-induced vibrations are presented in Table 8, and the minimum fatigue life is 46 years at the touch-down zone of the SCR, which exceeds the design fatigue life of 30 years. The wave motion fatigue is the major fatigue factor at the first weld below the hang-off while VIV contributes the most at the touch-down zone.
Combined Fatigue Lives
7. Sensitivity Analysis
A sensitivity analysis is conducted to evaluate the influence of the variation in the design parameters on the SCR strength and wave fatigue response. The reason for selecting design parameters is that these are directly associated with the amount of project cost which is the most important factor in the EPCIC project.
7.1 Strength Sensitivity Analysis
The analysis is performed for only the worst survival loading conditions that are defined from the base case of the dynamic analysis. The loading conditions are those that produce the maximum flex-joint rotation, the maximum von Mises stress utilization, the maximum top tension and the minimum tension at the touch-down zone. The design parameters for the strength sensitivity analysis are the drag coefficients, seabed stiffness, flex-joint stiffness, insulation thickness and taper stress joint length, as summarized in Table 9. The results of the strength sensitivity analysis are presented briefly in Table 10.
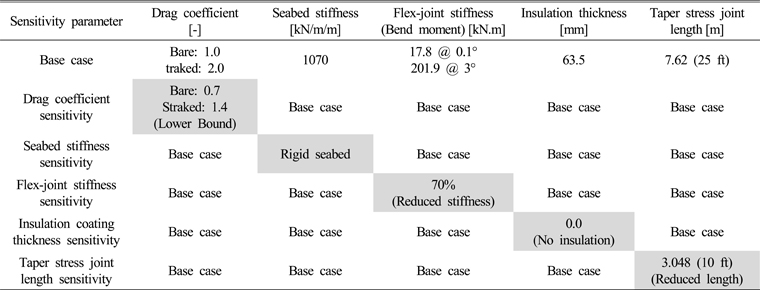
Strength sensitivity analysis load case matrix
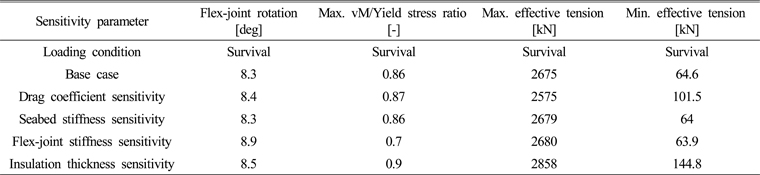
Strength sensitivity analysis results
The effects with respect to variation of drag coefficients which are from 1.0 for upper bound to 0.7 for lower bound on the flex-joint rotation angle, von Mises stress and top tension are found to be no greater influence relative to the base case. However, the minimum tension at the touch-down point with lower drag coefficients is found to increase considerably from 64.9kN to 88.0 kN, which is an increase in about 36%, as illustrated in Fig. 8.
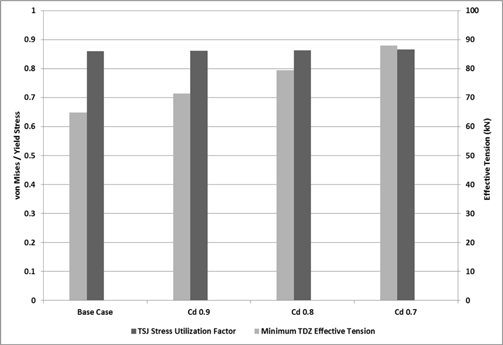
Strength sensitivity result with respect to drag coefficients
The SCR strength response is not generally sensitive to the seabed stiffness except at the touch-down point location as shown by Table 10. A rigid seabed reduces the minimum tension at the touch-down point to 64 kN from the approximately 65 kN that is found with the base case of the seabed stiffness of 1070 kN/m/m. The seabed stiffness is thus expected to have a more weighty impact on the fatigue performance of the SCR.
As can be seen from Fig. 9, the flex-joint stiffness that is assumed in the base case analysis is considered to have a high capacity. In particular, von Misses stress shows a downward trend by lower flex-joint capacity whereas rotation angle is an upward trend because of lower bending moment at hang-off region by reduced flex-joint stiffness. A reduction of 30% in the flex-joint stiffness shows that the maximum flex-joint rotation increases by about 7% from 8.3 degrees to around 9.0 degrees. In case of not considering the flex-joint, maximum rotation angle rises to about 11 degrees. On the other hand, the increase in the rotational flexibility decreases the maximum von Mises stress ratio near the hang-off by about 45%, from 0.86 to 0.47. The riser tension at hang-off region and touch-down zone is not affected by the flex-joint stiffness as shown in Table 10.
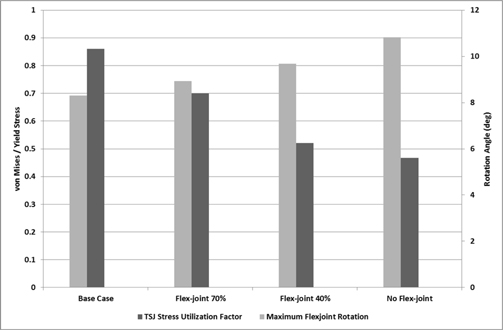
Strength sensitivity result with respect to flex-joint stiffness
Fig. 10 shows that the insulation thickness is not important to the riser stress and flex-joint rotation, respectively. A minor increase in the maximum top tension was found by the loss of the up-thrust contribution from the insulation if the insulation layer was not considered. In addition, the minimum tension at the touch-down point increases considerably from 64.9 kN to 145.6 kN, and the improved touch-down point tension can be achieved by lowering the drag loading that results from a smaller effective pipe diameter.
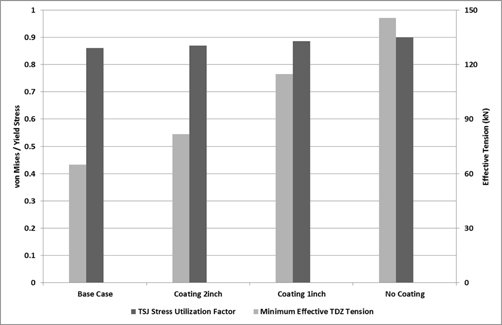
Strength sensitivity result with respect to insulation coating thickness
Fig. 11 describes the influence of taper stress joint length on riser strength. The reduction of taper stress joint length brings about increase in von Mises stress and bending moment of hang-off region. In particular, the maximum bending moment rises considerably from around 70 kNm at base case to about 200 kNm at reduced length case. The von Mises stress at base case also increases to just under 0.75 at reduced length case. Through this analysis, it is acknowledged that the taper stress joint provides a smooth bending stiffness transition between flex-joint and first welding point of steel catenary riser.
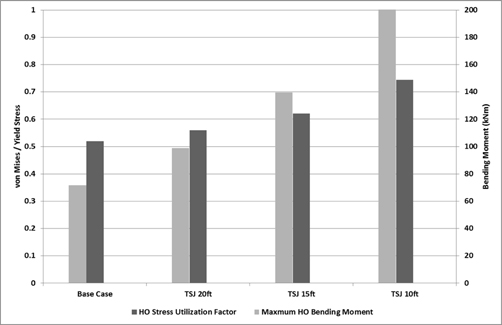
Strength sensitivity result with respect to taper stress joint length
7.2 Wave Fatigue Sensitivity Analysis
The design parameters for the wave fatigue analysis include the drag coefficients, insulation coating thickness, taper stress joint length, internal corrosion, FPSO draft and seabed stiffness, as shown in Table 11. The minimum wave fatigue lives at the top of the riser and at the touch-down zone for the different sensitivity parameters are presented in Table 12. The minimum wave fatigue life distributions at the hang-off region and the touch-down zone for the different design parameters are shown from Fig. 12 to Fig. 15.
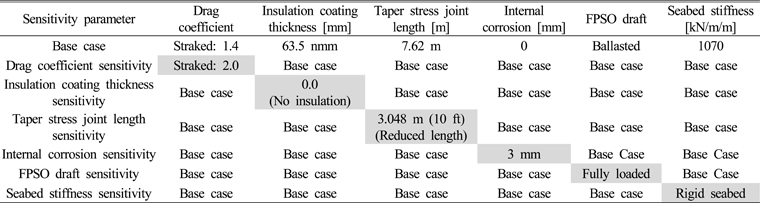
Wave fatigue sensitivity analysis load case matrix
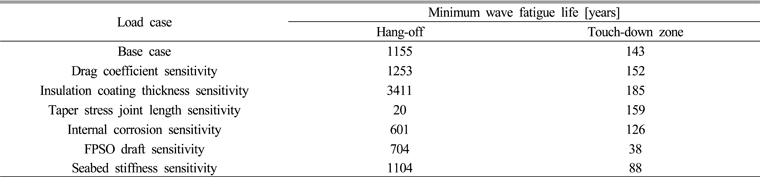
Wave fatigue sensitivity analysis results
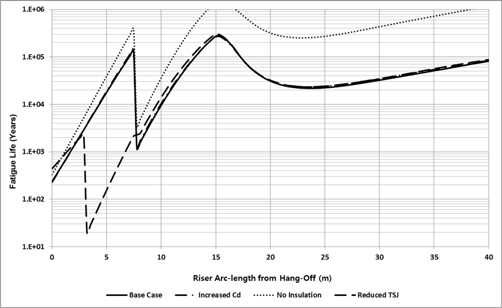
Fatigue sensitivity result with respect to design parameters at hang-off
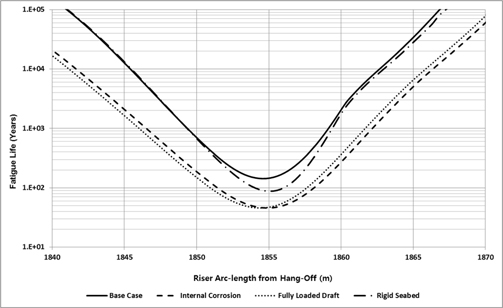
Fatigue sensitivity result of touch-down zone in case of conservative design
Fig. 12 and Fig. 13 illustrate the influence of design parameters at hang-off region and touch-down zone, respectively. The sensitivity check using a higher drag coefficient of 2.0 for the strake section shows that the minimum wave fatigue life increases from 143 years to 152 years at touch-down zone, which is an improvement of 6%, and also rises from 1155 years to 1253 years at hang-off region. The increase in the fatigue life can be attributed to the increase in the damping force on the riser that is rendered using a higher drag coefficient.
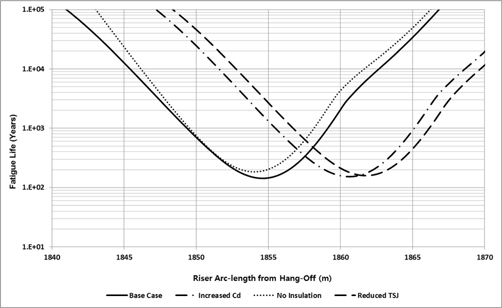
Fatigue sensitivity result with respect to design parameters
The wave fatigue performance of the SCR is sensitive to the insulation thickness. The sensitivity check without an insulation layer shows a significant improvement in the wave fatigue life along the SCR relative to the base case. The minimum wave fatigue life increases by about 30% from 143 years for the base case to 185 years for the case without an insulation layer at touch-down zone. The fatigue life at hang-off region rises by over three times more than base case. This improvement can be attributed to a reduction of the hydrodynamic loading on the SCR if an insulation layer is not considered.
The base case of the wave fatigue analysis is applied by a length of 7.620 m (25 ft) of taper stress joint. The sensitivity analysis considering a reduced length of 3.048 m (10 ft) of the taper stress joint shows an early more significant influence on the wave fatigue life at hang-off region than other design parameter. The wave fatigue life at hang-off region decreases considerably from 1155 years in base case to 20 years in the reduced taper stress joint even though the wave fatigue life at touch-down zone increases to 159 years. In case of the reduced taper stress joint, the wave fatigue life is not satisfied with the required design fatigue life(30 years). This drop can be caused by increased bending stress and von Mises stress at hang-off region.
As can be seen from Fig. 14 and Fig. 15, sensitivity analysis is conducted with respect to conservative design condition, such as internal corrosion, fully loaded FPSO and rigid seabed. In general, fatigue is a long term consideration and it might be conservative to consider completely corrosion on the riser during its whole service life. A sensitivity check assuming an average wall thickness loss of 3mm around the internal diameter is performed to explain the potential internal corrosion. It is observed that the minimum wave fatigue life decreases by about 50% (from 1155 years to 601 years) at hang-off region and also declines by around 12% (from 143 years to 126 years) at touch-down zone.
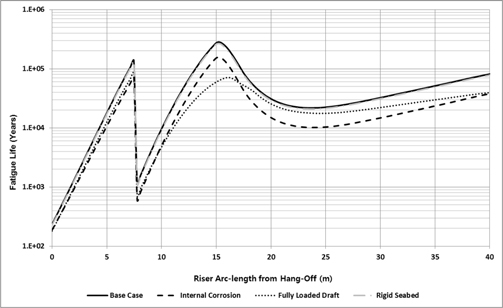
Fatigue sensitivity result of hang-off in case of conservative design at touch-down zone
The base case of the wave fatigue analysis considers a ballasted FPSO draft condition, and the sensitivity check shows that the FPSO motions under fully-loaded conditions produce a more severe riser wave fatigue response. The minimum wave fatigue life declines by about 73% (from 143 years to 38 years) at touch-down zone under fully loaded FPSO draft condition.
The wave fatigue response of the SCR at the touch-down point is particularly sensitive to the seabed stiffness. A rigid seabed is found to significantly decrease the minimum touch-down point fatigue life to 88 years relative to the base case fatigue life of 143 years, which is a decrease of approximately 40%. The decrease in the touch-down point fatigue life with a rigid seabed is estimated due to the higher riser touch-down point curvature than the elastic seabed. On the other hand, the wave fatigue life at hang-off region is not sensitive to seabed stiffness.
8. Conclusion
A design of SCR for a spread-moored FPSO in West Africa was carried out to obtain a suitable SCR configuration as an alternative concept design for hybrid riser. The strength analysis and fatigue analysis were conducted to evaluate the proposed SCR configuration. Finally, the sensitivity analysis with respect to the variation in the design parameters is conducted to assess the influences of variation in the design parameters.
The configuration of proposed SCR is satisfied with design requirements in terms of strength and fatigue life. This proposed SCR can be a suitable alternative option of hybrid riser applied to FPSO in West Africa.
The responses of the SCR strength are examined with respect to the variation in the design parameters. As can be seen from the strength analysis results, capacity of flex-joint stiffness and length of taper stress joint affect a huge increase of rotation angle(7%) and bending moment(180%), respectively. These components are essential for SCR design with respect to project cost as well as structure safety. Therefore, low level of optimal design for flex-joint and taper stress joint should be conducted to avoid excessive conservative design.
The influence of the wave fatigue life depending on the design variables is studied. Through the result of the wave fatigue analysis, it is true that insulation thickness, internal corrosion and taper stress joint have a great portion of wave fatigue life. In particular, reduced taper stress joint and full internal corrosion show a dramatic decrease of fatigue life, which represent 98% and 48%, respectively. The optimal length of taper stress joint should be obtained by riser design whereas internal corrosion can be anticipated by flow assurance analysis, which is considered at the stage of field development.
Notes
It is noted that this paper is revised edition based on proceedings of KSOE 2015 in Jeju.
References
Bai, X., Huang, W., Vaz, M.A., 2015. Riser-soil Interaction Model Effects on the Dynamic Behavior of a Steel Catenary Riser. Marine Structure, 41, 53-76.
Bai X., Huang W., Vaz M.A.. Riser-soil Interaction Model Effects on the Dynamic Behavior of a Steel Catenary Riser. Marine Structure 2015;41:53–76. 10.1016/j.marstruc.2014.12.003.Iranpour, M., Taheri, F., Kim, J.V., 2008. Structural Life Assessment of Oil and Gas Risers under Vortex-induced Vibration. Marin Struct, 21(4), 353–373.
Iranpour M., Taheri F., Kim J.V.. Structural Life Assessment of Oil and Gas Risers under Vortex-induced Vibration. Marin Struct 2008;21(4):353–373. 10.1016/j.marstruc.2008.02.002.Kim, S., Kim, M.H., 2015. Dynamic Behaviors of Conventional SCR and Lazy-wave SCR for FPSOs in Deepwater. Ocean Engineering, 106, 396-414.
Kim S., Kim M.H.. Dynamic Behaviors of Conventional SCR and Lazy-wave SCR for FPSOs in Deepwater. Ocean Engineering 2015;106:396–414. 10.1016/j.oceaneng.2015.06.039.Larsen, C.M., Hanson, T., 1999. Optimization of Catenary Risers. Journal of Offshore Mechanics and Arctic Engineering, Transactions of the ASME, 121(2), 90–94.
Larsen C.M., Hanson T.. Optimization of Catenary Risers. Journal of Offshore Mechanics and Arctic Engineering, Transactions of the ASME 1999;121(2):90–94. 10.1115/1.2830083.McGrail, J., Lim, F., 2004. SLOR vs. SCR for Deepwater Applications. Technical Paper, 2H Offshore Engineering, United Kingdom.
McGrail J., Lim F.. SLOR vs. SCR for Deepwater Applications. Technical Paper 2H Offshore Engineering; United Kingdom: 2004.Royer, B., Power, T., Ayewah, D., 2014. Assessment of Ultra-deepwater Riser Concepts for High-motion Vessels. Offshore Technology Conference, Houston.
Royer B., Power T., Ayewah D.. Assessment of Ultra-deepwater Riser Concepts for High-motion Vessels In : Offshore Technology Conference. Houston; 2014.Wang, J., Duan, M., 2015. A Nonlinear Model for Deepwater Steel Lazy-wave Riser Configuration with Ocean Current and Internal Flow. Ocean Engineering, 94, 155-162.
Wang J., Duan M.. A Nonlinear Model for Deepwater Steel Lazy-wave Riser Configuration with Ocean Current and Internal Flow. Ocean Engineering 2015;94:155–162. 10.1016/j.oceaneng.2014.11.025.Xia, J., Das, P., Karunakaran, D., 2008. A Parametric Design Study for a Semi/SCR System in Northern North Sea. Ocean Engineering, 35(17), 1686-1699.
Xia J., Das P., Karunakaran D.. A Parametric Design Study for a Semi/SCR System in Northern North Sea. Ocean Engineering 2008;35(17):1686–1699. 10.1016/j.oceaneng.2008.09.007.Yang, H.Z., Li, H.-J., 2011. Sensitivity Analysis of Fatigue Life Prediction for Deepwater Steel Lazy Wave Catenary Risers. Science China Technological Sciences, 54(7), 1881-1887.
Yang H.Z., Li H.-J.. Sensitivity Analysis of Fatigue Life Prediction for Deepwater Steel Lazy Wave Catenary Risers. Science China Technological Sciences 2011;54(7):1881–1887. 10.1007/s11431-011-4424-y.Yang, H.Z., Li, H.J., Park, H.I., 2011. Optimization Design for Steel Catenary Riser with Fatigue Constraints. International Journal of Offshore and Polar Engineering, 21(04).
Yang H.Z., Li H.J., Park H.I.. Optimization Design for Steel Catenary Riser with Fatigue Constraints. International Journal of Offshore and Polar Engineering 2011;21(04)Yang, H.Z., Zheng, W., 2011. Metamodel Approach for Reliability-based Design Optimization of a Steel Catenary Riser. Journal of Marine Science and Technology, 16(2), 102–213.
Yang H.Z., Zheng W.. Metamodel Approach for Reliability-based Design Optimization of a Steel Catenary Riser. Journal of Marine Science and Technology 2011;16(2):102–213.Yue, B., Campbell, M., Walters, D., Thompson, H., Raghavan, K., 2010. Improved SCR Design for Dynamic Vessel Applications. 29th International Conference on Ocean, Offshore and Arctic Engineering, Shanghai.
Yue B., Campbell M., Walters D., Thompson H., Raghavan K.. Improved SCR Design for Dynamic Vessel Applications In : 29th International Conference on Ocean, Offshore and Arctic Engineering. Shanghai; 2010.