An Analysis of the Impact of Building Wind by Field Observation in Haeundae LCT Area, South Korea: Typhoon Omais in 2021
Article information

Abstract
In the Haeundae area of Busan, South Korea, damage has continued to occur recently from building wind from caused by dense skyscrapers. Five wind observation stations were installed near LCT residential towers in Haeundae to analyze the effect of building winds during typhoon Omais. The impact of building wind was analyzed through relative and absolute evaluations. At an intersection located southeast of LCT (L-2), the strongest wind speed was measured during the monitoring. The maximum average wind speed for one minute was observed to be 38.93 m/s, which is about three times stronger than at an ocean observation buoy (12.7 m/s) at the same time. It is expected that 3 to 4 times stronger wind can be induced under certain conditions compared to the surrounding areas due to the building wind effect. In a Beaufort wind scale analysis, the wind speed at an ocean observatory was mostly distributed at Beaufort number 4, and the maximum was 8. At L-2, more than 50% of the wind speed exceeded Beaufort number 4, and numbers up to 12 were observed. However, since actual measurement has a limitation in analyzing the entire range, cross-validation with computational fluid dynamics simulation data is required to understand the characteristics of building winds.
1. Introduction
As higher concentrations of high-rise buildings in urban areas cause changes in the air flow patterns of the surrounding areas, wind gusts moving over the walls of tall buildings occur and have a negative impact on the wind environment for pedestrians. Building wind refers to the phenomenon in which wind blows against tall buildings in urban areas and generates strong gusts. In the Haeundae area of Busan, which has the highest density of high-rise buildings in South Korea, various damages caused by building winds have continuously occurred in recent years, such as falling building attachments, the spread of wind-born debris, and noise generated by wind. Building wind is caused by an increase in wind speed and wind pressure among buildings. As damages caused by building wind have become a social issue, this phenomenon has gathered increasing attention as a new type of urban disaster.
Building wind also has a positive aspect of decreasing the urban heat-island effect through winds that facilitate the circulation of heat trapped in urban areas, but its negative impacts emerged as a serious concern when powerful typhoons recently hit South Korea. When Typhoon Maysak and Typhoon Haishen occurred in South Korea in 2020, they caused dangerous situations, including damage to the exterior wall tiles of buildings and glass windows of high-rise buildings in Haeundae.
In countries such as the U.K., Canada, the Netherlands, and Japan, when a high-rise building is constructed, it is mandatory to conduct an assessment of building wind around the construction site in the design or planning stage of a building construction project. In recent years, building wind has been recognized as a social problem in South Korea and other countries, so the central and local governments of South Korea have been trying to establish measures to prevent or mitigate the impact of building wind. However, there is a lack of basic research data for the development of measures suitable for South Korean situations.
In previous studies in South Korea, Roh (2008) carried out a computational fluid dynamics (CFD) analysis for two apartment complexes in Cheonan-si to derive alternative construction techniques and present design standards. Shin et al. (2005) investigated the wind environment and methods for reducing wind disasters by performing field observation and CFD analysis. Choi and Cho (2012) conducted an analysis of the wind corridor of apartment buildings by using CFD analysis.
A number of numerical studies on the impact of building wind have been done. Cho et al. (2012) pointed out that research on the reliability of numerical analysis should be conducted prior to a study of the applicability of numerical methods and stated that there is a need to conduct research on measured data as a criterion for evaluation of the reliability of numerical analysis.
Against this background, we conducted a quantitative analysis of changes in the wind environment caused by the impact of building wind. We performed field monitoring of building wind near the ground surface in areas around high-rise buildings in Haeundae, Busan, when the area was directly affected by Typhoon Omais in 2021.
2. Field Monitoring
2.1 Research Site
The area selected as a research site in this study was around an apartment complex named LCT in Haeundae in Busan, which is South Korea’s largest port city (Fig. 1). When field observations of building wind are conducted, it is necessary to measure winds that are influenced by buildings, so monitoring points are generally in areas greatly influenced by the surrounding environment, such as areas around high-rise buildings or residential areas. LCT consists of three buildings: the landmark tower and towers A and B. Since the surround buildings have much lower heights, strong local winds or scattered winds occur in the LCT area. In addition, since it is located in a coastal area that is vulnerable to wind and flood hazards, the area around LCT is frequently affected by building winds.

Location and drone photo of research site
The landmark tower of LCT is the second tallest building in South Korea with a maximum height of 411.6 m. To observe building wind in the areas around high-rise buildings, five fixed anemometers were installed at scattered points in the research site. More specifically, the monitoring points included locations where strong winds are expected to blow from the open sea (L-1, 5), where strong winds were observed during a preliminary field investigation (L-1, 2, 3), and intersections (L-2, 3, 4). The observation equipment was installed at a height of 4.0 to 8.0 m in consideration of field situations. The locations of monitoring points are shown in Fig. 2 (
 ).
).

Installation point of wind speed and wind direction observation equipment: (a) Installation point (L1‒5); (b) View of point L-1 (height: 5 m); (c) View of point L-2 (height: 6 m); (d) View of point L-3 (height: 4 m); (e) View of point L-4 (height: 4.6 m); (f) View of point L-5 (height: 4 m)
2.2 Observation Equipment
The monitoring equipment used to observe the impact of building wind (Fig. 3) was designed in accordance with the standard specifications for an automatic weather station (AWS) (Korea Meteorological Administration, 2018). The equipment specifications are presented in Table 1. Data were collected at 0.25-second intervals, so 4 data per second (345,600 data/day) were collected according to the standard specifications of an AWS (Korea Meteorological Administration, 2018). The average wind direction and wind speed for 1 minute were obtained by calculating the average values of the past 240 data collected for 1 minute.

Observation equipment
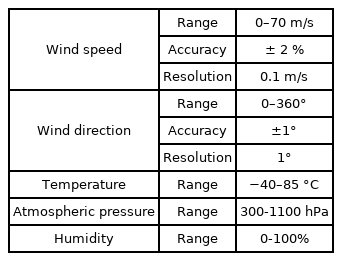
Specifications of observation equipment
2.3 Haeundae Ocean Observatory
The Haeundae ocean observation buoy is located at Haeundae Beach about 400 m south of the LCT area and is shown in Fig. 4 (
 ). The Haeundae ocean observation buoy is the meteorological observatory in the area that is closest to the research site and is located in an area with relatively little interference. For these reasons, it was selected as a reference point for comparative analysis of building wind. The reference data were the one-minute average wind speed and wind direction data from the Haeundae ocean observatory. Since building wind characteristically generates local gusts in a short time, the one-minute average data were set as the reference data based on the shortest time unit of the data provided by the ocean observatory.

Haeundae ocean observatory
2.4 Typhoon Omais
Typhoon Omais was the 12th typhoon in 2021. It was a tropical storm with a central pressure of 1004 hPa, a maximum wind speed of 18 m/s, and a strong wind radius of 110 km. It occurred at 21:00 on August 23 in 2021 in the sea about 850 km south-southeast of Okinawa, Japan (Fig. 5). Typhoon Omais was the first typhoon that landed on South Korea in 2021 and started to affect it in the afternoon on August 23. The typhoon disappeared at 09:00 on August 24 according to the Japan Meteorological Agency. Therefore, the monitoring period was set as 00:00 on August 23 to 00:00 on August 25, and measured data collected for a total of 48 hours were used for this study.
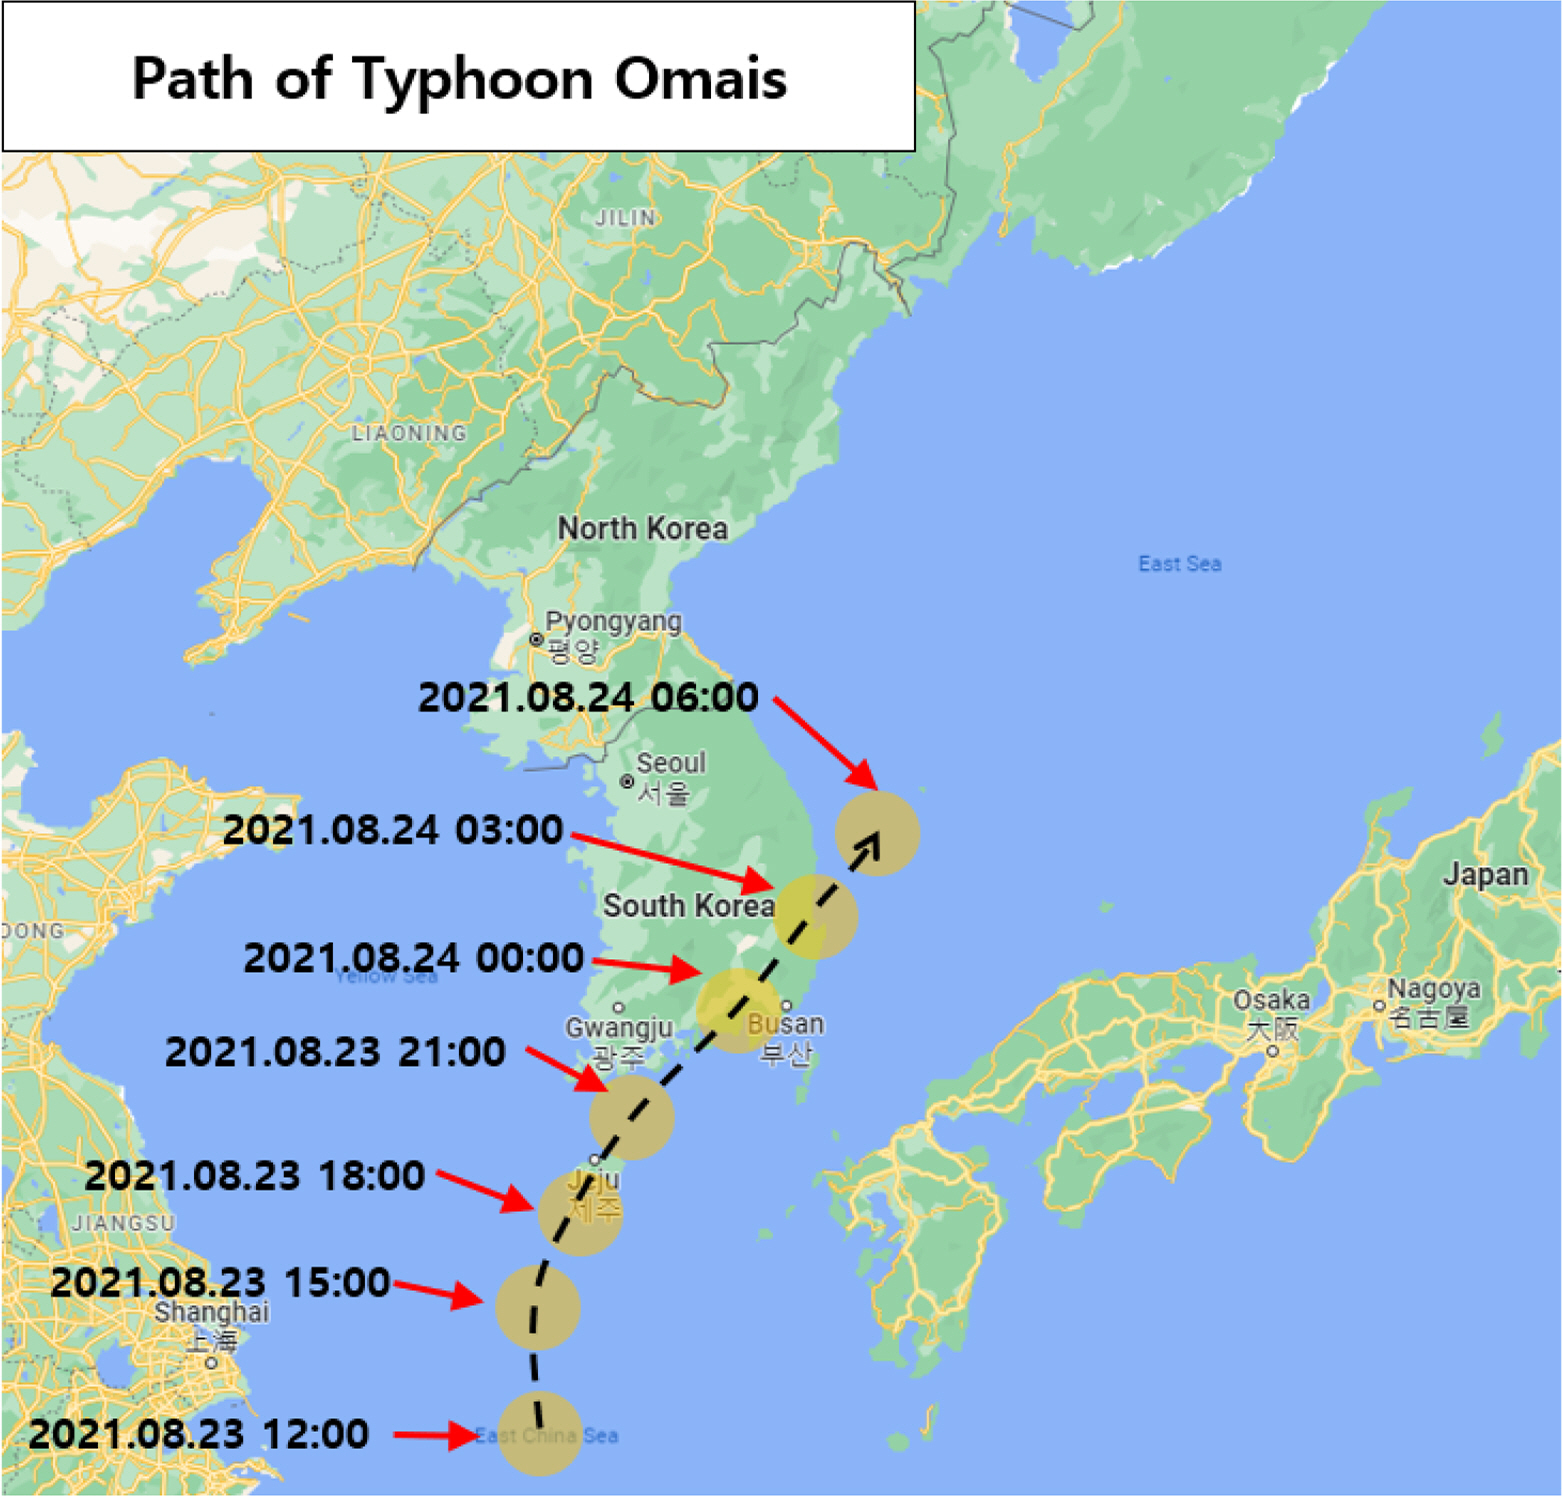
Path of Typhoon Omais
3. Analysis of the Impact of Building Wind
The methods for assessing the impact of building wind include evaluation in terms of the rate of increase in wind speed (relative evaluation method), evaluation in terms of the allowed wind speed (absolute evaluation method), and a probabilistic evaluation method based on wind-occurrence probability (Kim, 2018). In this study, relative and absolute evaluation methods were employed to evaluate building winds. For the relative evaluation method, the wind speed from Haeundae ocean observatory was set as the reference wind speed, and the wind speed ratio of each monitoring point was calculated by Eq. (1) to examine the rate of increase or decrease in wind speed due to the impact of building wind.
In Eq. (1), Wind Speed Ratio (R) denotes the wind speed ratio of at each monitoring point, wind speedLi (m/s) is the wind speed of at each monitoring point, and wind speedOcean Observatory (m/s) is the wind speed of at the ocean observatory. Although this method is a convenient method that allows objective comparisons, evaluation using the wind speed ratio is not an appropriate method if there is no meteorological station in the vicinity or if the observation location and the surrounding environment have completely different locational characteristics. However, since there is was the an ocean observatory in an area adjacent to the LCT observation points, and it could be used as a comparison groupfor comparison, and the method was considered as an adequate evaluation method. As Ffor the absolute evaluation method, the Beaufort wind scale presented by Penwarden was used. Table 2 shows the wind speed classified from as 0 to 12 on the Beaufort wind scale and the impact on the human body for each Beaufort number (National Wweather Sservice, 2016).

Beaufort wind scale
3.1 Ocean Observatory
Fig. 6 shows the one-minute average wind speed data (
 ) at the ocean observatory during the study period. At the observatory, a maximum average wind speed of 18.5 m/s was recorded at 01:07 on August 24. After that, the wind speed decreased, but it started to increase again at 12:00 on August 24. Then, a maximum average wind speed of 15.5 m/s (west-southwest) was observed at 12:26 on August 24, and high wind speed was maintained until 16:00. The prevailing wind directions at the ocean observatory during the monitoring period were west-southwest(24.77%) and southwest (18.64%).

Wind speed comparison (LCT
 vs. Ocean observatory
). (a) L-1 vs. Ocean observatory; (b) L-2 vs. Ocean observatory; (c) L-3 vs. Ocean observatory; (d) L-4 vs. Ocean observatory; (e) L-5 vs. Ocean observatory
vs. Ocean observatory
). (a) L-1 vs. Ocean observatory; (b) L-2 vs. Ocean observatory; (c) L-3 vs. Ocean observatory; (d) L-4 vs. Ocean observatory; (e) L-5 vs. Ocean observatory
3.2 The Wind Speed and Wind SpeedRratio of the LCT Area (Relative Evaluation Method)
Fig. 6 shows the one-minute average wind speed (
) measured at 5 monitoring points (L-1–L-5) in the LCT area. In addition, the wind speed ratio (
 ) of each monitoring point is shown in Fig. 7. The speed ratio is the ratio of the wind speed at each monitoring point to the wind speed at the ocean observatory.

Frequency distribution of wind speed ratio (LCT vs. Ocean observatory); (WindspeedLCT/WindspeedOceanobservatory
). (a) L-1 vs. Ocean observatory; (b) L-2 vs. Ocean observatory; (c) L-3 vs. Ocean observatory; (d) L-4 vs. Ocean observatory; (e) L-5 vs. Ocean observatory
A large amount of wind speed data was missing at points L-1 and L-2 due to mechanical defects, and the missing rate is shown in Table 3. In the calculation of the wind speed ratio, missing wind speed data were excluded. Some wind speed ratios obtained were excessively high values of 5‒25, which may be attributed to the fact that wind speed measured at the ocean observatory were much lower, even though the wind speeds at each monitoring point were low. Therefore, in this study, the wind speed ratio was calculated only for cases where the wind speed at the ocean observatory was 2 m/s or more to derive wind speed ratios for only cases where significant wind speed values were observed.

Missing rate at each point (L1‒5)
The one-minute average wind speeds at L-1 are shown in Fig. 6(a). The maximum average wind speed recorded at L-1 during the monitoring period was 35.23 m/s at 01:35 on August 24. At this time, the wind speed at the ocean observatory was 15.5 m/s (west-southwest). The maximum wind speed at L-1 was 2.27 times stronger than the wind speed measured at the ocean observatory during the same period of time. The wind speed ratio of L-1 is shown in Fig. 7(a) and ranges from 0 to 3.86. The maximum wind speed ratio of 3.86 was observed at 17:56 on August 23. At this time, the wind speed at L-1 was 7.71 m/s, and the wind speed at the ocean observatory was 2 m/s (north).
The one-minute average wind speed at L-2 is shown in Fig. 6(b). The maximum average wind speed measured at L-2 was 38.93 m/s (south), and it was observed at 00:37 on August 24. At the time, the wind speed at the ocean observatory was 12.7 m/s (south-southwest). The maximum wind speed at L-2 was 3.07 times stronger than the wind speed measured at the ocean observatory at the same time point.
The wind speed ratio of L-2 is shown in Fig. 7(b) and it ranges from 0 to 4.57. The maximum wind speed ratio of 4.47 was observed at 18:13 on August 23. At this time, the wind speed at L-2 was 9.59 m/s, and the wind speed at the ocean observatory was 2.1 m/s (northeast).
The one-minute average wind speed of L-3 are shown in Fig. 6(c). The maximum average wind speed measured at L-3 was 36.77 m/s (south), and it was observed at 00:37 on August 24. At this time, the wind speed at the ocean observatory was 12.7 m/s (south-southwest). The maximum wind speed at L-3 was 2.89 times stronger than the wind speed measured at the ocean observatory during the same period of time.
The wind speed ratio of L-3 is shown in Fig. 7(c) and it ranges from 0 to 2.89. The maximum wind speed ratio of 2.89 was observed at 00:37 on August 24. At this time, the wind speed at L-3 was 36.77 m/s (south), and the wind speed at the ocean observatory was 12.7 m/s (south-southwest).
The one-minute average wind speed of L-4 are shown in Fig. 6(d). The maximum average wind speed measured at L-4 was 22.21 m/s (southwest), and it was observed at 00:52 on August 24. At this time, the wind speed at the ocean observatory was 17.9 m/s (south-southwest). The maximum wind speed at L-4 was 1.24 times stronger than the wind speed measured at the ocean observatory during the same period of time.
The wind speed ratio is shown in Fig. 7(d). It ranges from 0 to 2.13, and the maximum wind speed ratio of 2.13 was observed at 21:23 on August 24. At this time, the wind speed at L-4 was 8.73 m/s (south-southwest), and the wind speed at the ocean observatory was 4.1 m/s (west).
The one-minute average wind speed of L-5 are shown in Fig. 6(e). The maximum average wind speed measured at L-5 was 18.0 m/s (southwest), and it was observed at 01:44 on August 24. At this time, the wind speed at the ocean observatory was 16.3 m/s (southwest). The maximum wind speed at L-5 was 1.10 times stronger than the wind speed measured at the ocean observatory during the same period of time.
The wind speed ratio of L-5 is shown in Fig. 7(e). It ranges from 0 to 1.44, and the maximum wind speed ratio of 1.44 was observed at 12:34 on August 24. At this time, the wind speed at L-5 was 14.27 m/s (west-southwest), and the wind speed at the ocean observatory was 9.9 m/s (west).
3.3 Beaufort Wind Scale (Absolute Evaluation Method)
Since wind damage generally occurs due to strong wind speed, it is necessary to assess the absolute value of the increase in wind speed due to the impact of building wind. Thus, wind speed was measured at the five monitoring points of the LCT area (
 ) and at the Haeundae ocean observatory (
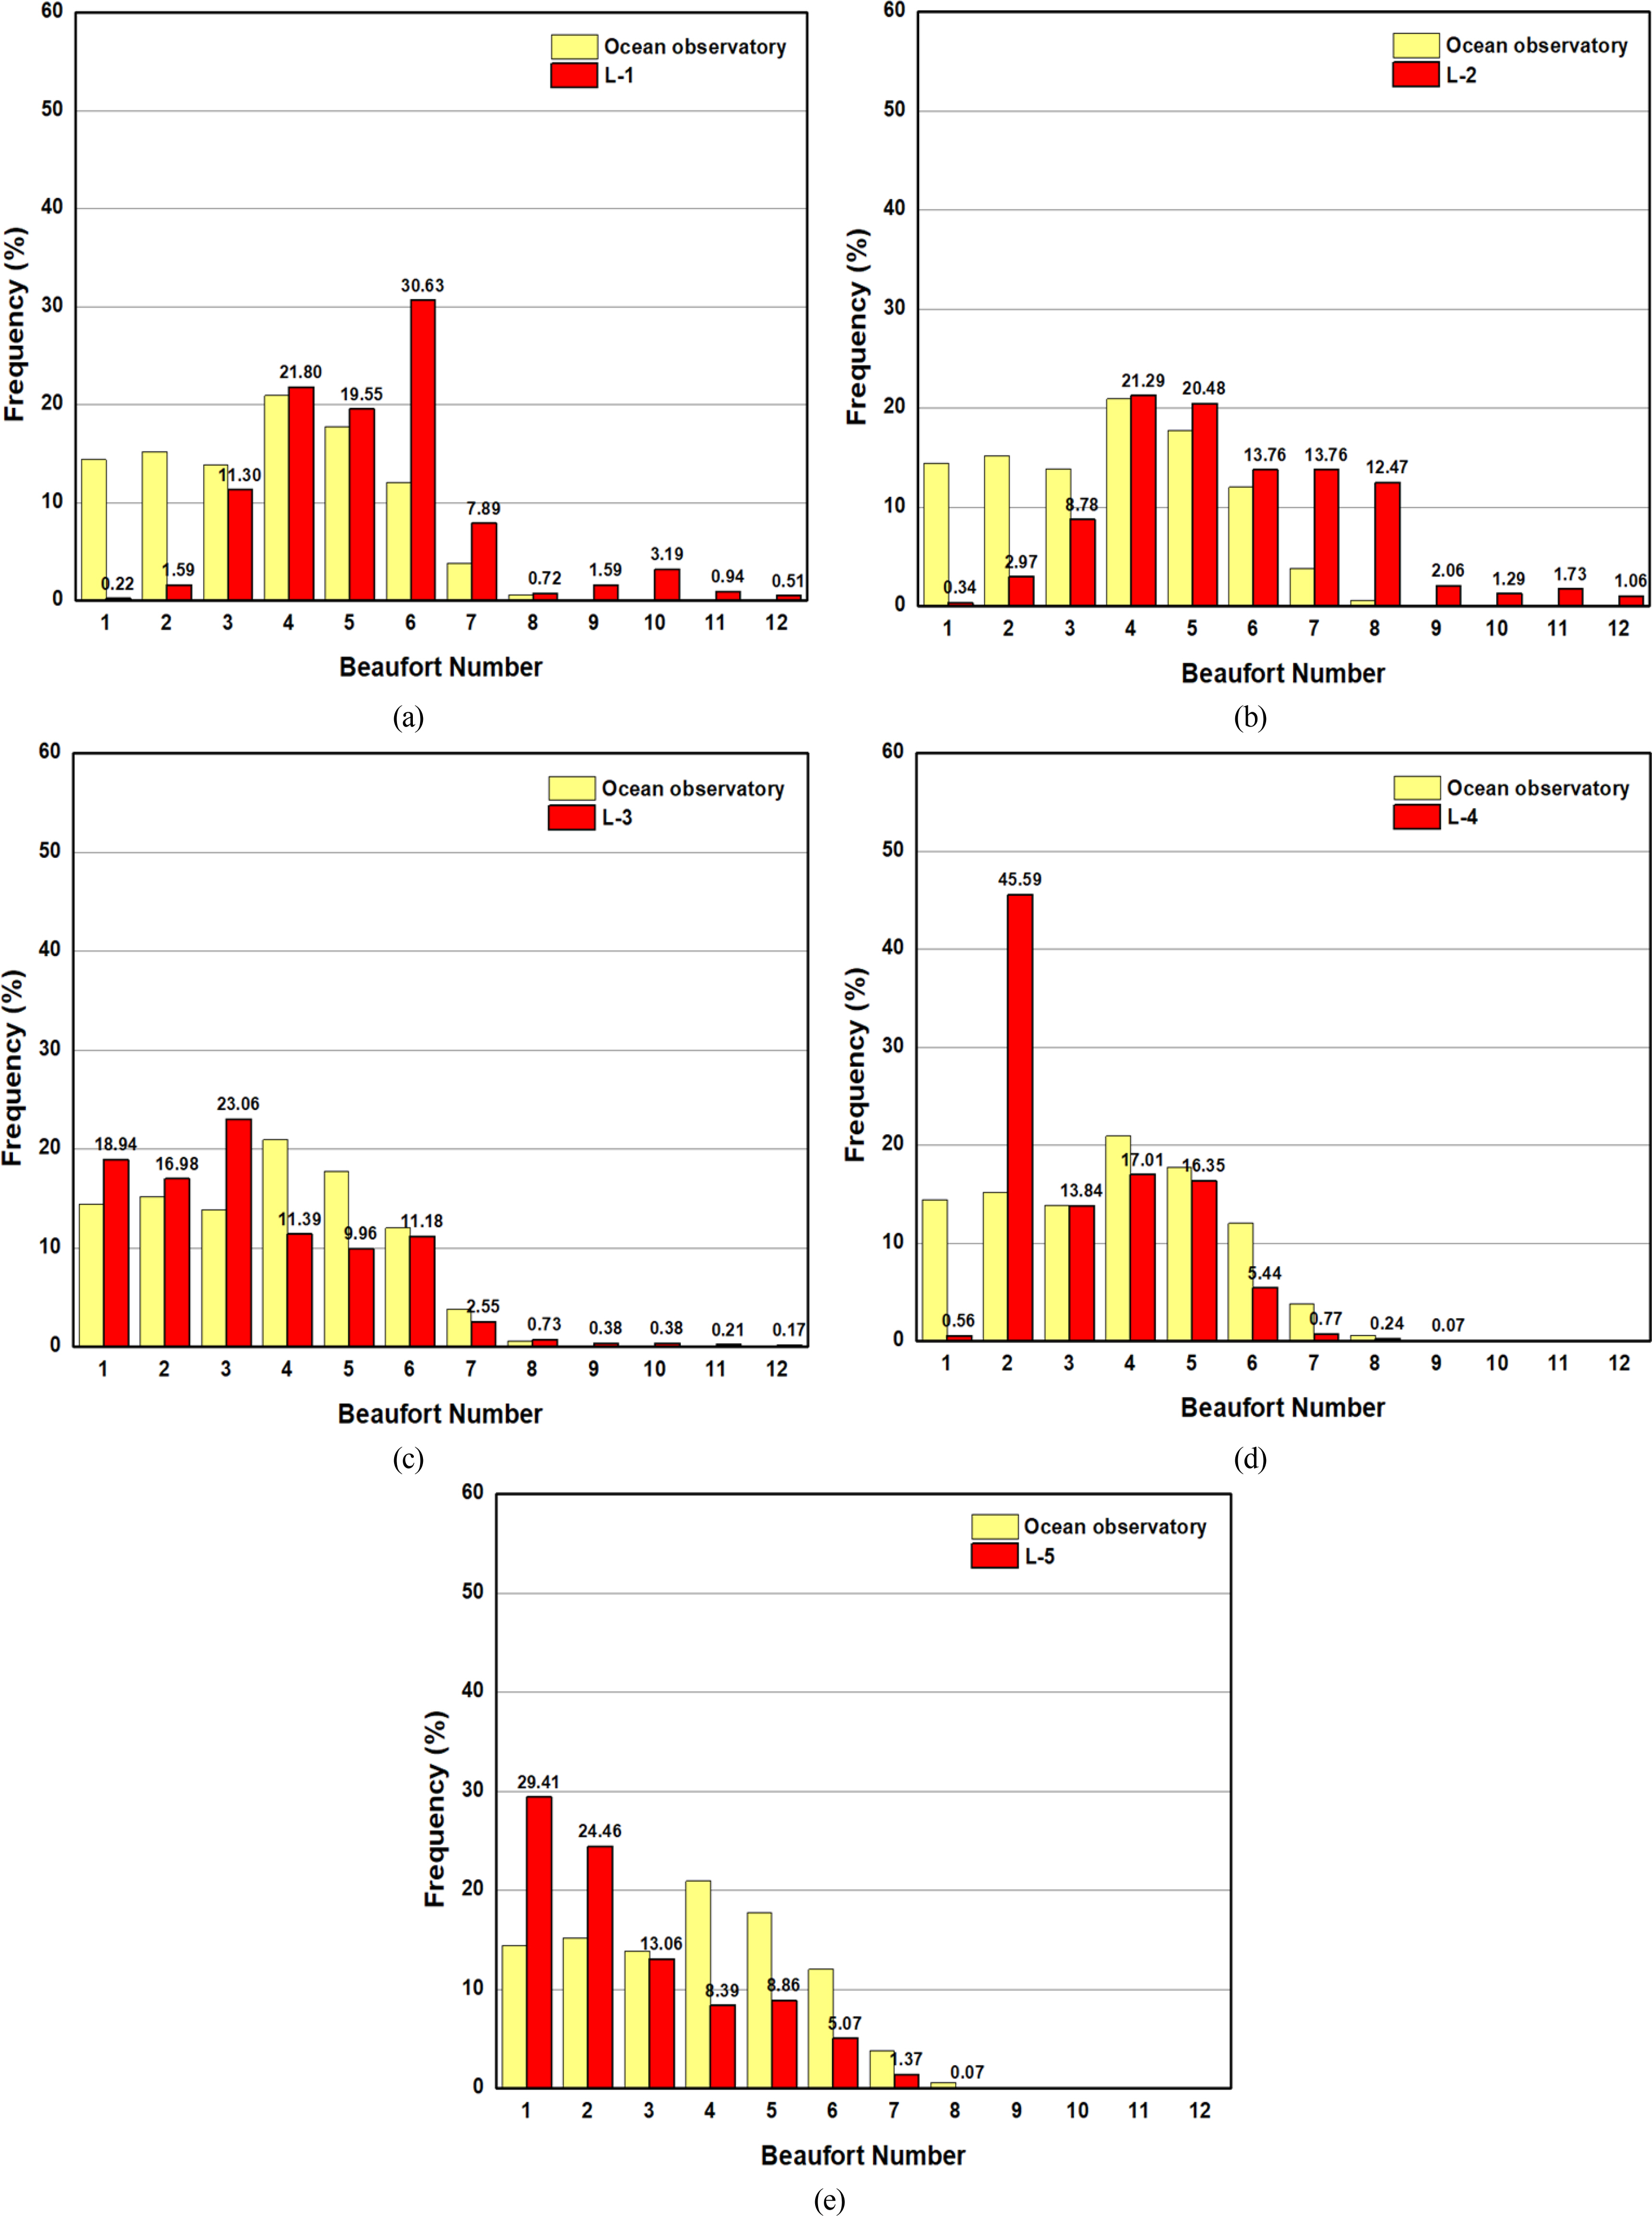
 ) and are presented in a graph to show the frequencies of the wind speed by applying the Beaufort wind scale (Table 2), as shown in Fig. 8. A comparative analysis was performed by excluding missing data and Beaufort numbers of 0 (calm) from the analysis for convenience.
Frequency distribution of Beaufort wind scale (LCT
vs. Ocean observatory
). (a) L-1 vs. Ocean observatory; (b) L-2 vs. Ocean observatory; (c) L-3 vs. Ocean observatory; (d) L-4 vs. Ocean observatory; (e) L-5 vs. Ocean observatory
The Beaufort number of wind speed observed at the ocean observatory ranged from 1 to 8, and the frequencies of Beaufort numbers 1 to 8 were 14.44, 15.17, 13.91, 20.95, 17.76, 12.02, 3.82, and 0.60 %, respectively. The mode was 4 (moderate breeze), and the highest Beaufort number was 8 (gale). We performed a comparative analysis between the Beaufort number at the ocean observatory and those at each monitoring point in the LCT area, as shown in Figs. 8(a)–8(e). The Beaufort numbers observed at L-1 are shown in Fig. 8(a). The Beaufort number ranged from 1 to 12, and the frequencies of the Beaufort numbers 1 to 12 were 0.22, 1.59, 11.30, 21.80, 19.55, 30.63, 7.89, 0.72, 1.59, 3.19, 0.94, and 0.51%, respectively. The mode was 6 (strong breeze), and the highest Beaufort number was 12 (hurricane). The Beaufort numbers observed at L-2 are shown in Fig. 8(b). The Beaufort numbers ranged from 1 to 12, and their frequencies of the were 0.34, 2.97, 8.78, 21.29, 20.48, 13.76, 13.76, 12.47, 2.06, 1.29, 1.73, and 1.06%, respectively. The mode was 4 (moderate breeze), and the highest Beaufort number was 12 (hurricane).
The Beaufort numbers observed at L-3 are shown in Fig. 8(c). The Beaufort numbers ranged from 1 to 12, and their frequencies were 18.94, 16.98, 23.06, 11.39, 9.96, 11.18, 2.55, 0.73, 0.38, 0.38, 0.21, and 0.17%, respectively. The mode was 3 (gentle breeze), and the highest Beaufort number was 12 (hurricane). The Beaufort numbers observed at L-4 are shown in Fig. 8(d). The Beaufort numbers ranged from 1 to 9, and their frequencies were 0.56, 45.59, 13.84, 17.01, 16.35, 5.44, 0.77, 0.24, and 0.07%, respectively. The mode was 2 (light breeze), and the highest Beaufort number was 9 (severe gale). The Beaufort numbers observed at L-5 are shown in Fig. 8(e). The Beaufort numbers ranged from 1 to 8, and their frequencies were 29.41, 24.46, 13.06, 8.39, 8.86, 5.07, 1.37, and 0.07%, respectively. The mode was 1 (light air), and the highest Beaufort number was 8 (gale).
4. Discussion
In this study, we conducted field monitoring of Typhoon Omais by installing 5 anemometers to examine the impact of building wind in the area around LCT, an area with a high density of high-rise buildings. The analysis of the measured data was conducted by both the relative evaluation method by the estimation of wind speed ratios (the rates of increase in wind speed) and the absolute evaluation method using the Beaufort wind scale, and the following conclusions were drawn based on the analysis results. The comparative analysis between the measured data at each observation point and those at the ocean observatory revealed different building wind patterns depending on the locational characteristics at each observation point. At L-1, a maximum wind speed of 35.25 m/s and a maximum wind speed ratio of 3.86 were measured. L-1 was located near the side of the landmark tower building of LCT and adjacent to the seashore of Haeundae. In view of these characteristics of L-1, high wind speeds observed at L-1 are thought to be due to the fact that sea breeze blowing from the sea towards land flows over the walls of the tall building without any interference, generating separated flow and downslope wind.
At L-2, a maximum wind speed of 38.93 m/s and maximum wind speed ratio of 4.57 were observed. The highest maximum wind speed and wind speed ratio were observed at L-2 among the five monitoring points. It is presumed that since L-2 was located at the corner of an LCT building, the separated flow and downslope wind of the building were combined, so this location showed a significant impact of building wind. At L-3, a maximum wind speed of 36.77 m/s and maximum wind speed ratio of 2.89 were measured. Strong wind speed observed at L-3 are thought to be due to the fact that this monitoring point was located at an intersection surrounded by buildings and on bare ground without obstacles around the monitoring location.
On the other hand, L-4 showed a maximum wind speed of 22.21 m/s and maximum wind speed ratio of 1.24, even though it was situated at an intersection among high-rise buildings like L-3. In other words, L-4 showed less impact of building wind compared to L-1, L-2, and L-3. These results are believed to reflect the impact of trees planted around L-4. In a previous study, Cheong and Ryu (2013) performed CFD analysis to investigate the windbreak effects of trees. The results of their study showed that planted trees decreased the maximum wind speed at the level of pedestrians around buildings from Beaufort force 11 to Beaufort force 9. In addition, Kim et al. (2013) demonstrated the windbreak effects of vegetation through a wind tunnel experiment. In the present study, L-4, which had surrounding areas with planted trees, showed lower maximum wind speed than other monitoring locations. In consideration of the previous studies on the windbreak effects of trees, the lower wind speed of L-4 can be attributed to the impact of trees.
L-5 was located in front of LCT buildings, where there was a small impact of building wind. As a result, L-5 showed the lowest maximum wind speed of 18.00 m/s and the lowest maximum wind speed ratio of 1.10 among the five monitoring points. In addition, there was a low-rise structure with the height of a three-story building between L-5 and LCT buildings. Because this low-rise structure acted as a set-back structure that offset building winds such as downslope wind, the building wind had less impact on L-5. Set-back structures are effective in reducing downslope winds and separated flows (City of Toronto, 2013). In this study, the data of L-5 confirmed this.
At L-1 and L-2, the frequency of Beaufort wind scale 6 or higher was found to be about 50%. In addition, at L-2, where the highest maximum wind speed was observed during the monitoring period, the frequency of Beaufort wind scale 8 or higher was about 20%. At Beaufort wind scale 6, pedestrians feel uncomfortable when walking outside, and at Beaufort wind scale 8 or higher, pedestrians are likely to fall since they have difficulty in maintaining balance. In other words, the measured data of L-1 and L-2 indicate that the areas near these points have a very poor wind environment for pedestrians.
At L-1, L-2, and L-3, the highest value on the Beaufort wind scale of 12 was observed. Compared to the maximum Beaufort wind scale value of 8 at the Haeundae ocean observatory, these results indicated that there was a large increase in wind speed at L-1, L-2, and L-3. These increases in wind speed are thought to show that wind speeds at these monitoring points were greatly affected by building wind. At L-4 and L-5, which were influenced by trees and a set-back structure, the highest Beaufort numbers observed were 9 and 8, respectively, and they are close to the Beaufort numbers at the Haeundae ocean observatory. This result confirmed again that L-4 and L-5 were less affected by building wind compared to L-1, L-2, and L-3.
Kim et al. (2021) investigated building wind through field monitoring data of the Marine City area of Haeundae during the landfall of Typhoon Omais. A maximum wind speed of 28.99 m/s and maximum wind speed ratio of 2.92 were measured. The highest Beaufort number was 11. In the present study, the location where the strongest building wind was observed was L-2 with a maximum wind speed of 38.93 m/s and maximum wind speed ratio of 3.07. The highest Beaufort number observed in the LCT area was 12, and it was observed at L-1, L-2, and L-3.
The height of the tallest building in the Marine City area is 301 m, which is lower compared to the maximum height of the buildings of LCT. This seems to be the reason why the impact of building wind was smaller in the Marine City area than in the LCT area. As in L-4, where planted trees were found to function as a wind-breaking forest, the two points with planted trees in the Marine City area showed a lower building wind impact. This demonstrates that a wind-breaking forest is effective in reducing the impact of building wind.
This study has some limitations. First, we could not analyze the risk of building wind for a broad range of the research site because there was not a sufficient number of observation points, and measurements of wind speed at different altitudes were not performed. Therefore, a follow-up study should be conducted with CFD simulation for the entire range and cross-validation between measured data and CFD simulation data.
Notes
Soonchul Kwon serves as an editor of the Journal of Ocean Engineering and Technology but hads no role in the decision to publish this article. No potential conflict of interest relevant to this article was reported.
This research was supported by a grant (20011068) from the Regional Customized Disaster-Safety R&D Program, which is funded by the Ministry of Interior and Safety (MOIS, Korea).