Dynamic Behavior Assessment of OC4 Semi-submersible FOWT Platform Through Morison Equation
Article information

Abstract
This paper proposes an effective inertia coefficient (EIC) in the Morison equation for better wave-force calculations. The OC4 semi-submersible floating offshore wind turbine (FOWT) platform was considered to test the feasibility. Large diffraction at large Keulegan–Carpenter (KC) numbers and the interaction between columns can result in errors in estimating the wave force using the Morison equation with a theoretical inertia coefficient, which can be corrected by the EIC as a function of the wave period and direction. The horizontal and vertical wave forces were calculated using the Morison equation and potential theory at each column, wave period, and wave direction. The EICs of each column were then obtained, resulting in a minimal difference between the Morison inertia force and the wave excitation force by the potential theory. The EICs, wave forces, phase angles, and dynamic motions were compared to confirm the feasibility of an EIC concept under regular and random waves.
1. Introduction
Cylindrical floating and underwater structures are used widely, including spar-type offshore platforms, monopile offshore wind turbines, spar and semi-submersible floating offshore wind turbines (FOWTs), marine risers and pipelines, and submerged floating tunnels. Several frequency- and time-domain numerical methods have been proposed to understand the hydrodynamic behaviors. In particular, in time domain analysis, computational fluid dynamics (CFD), potential-flow-based numerical wave tank, and Cummins equation have been used to assess the wave forces and dynamic behaviors of cylindrical structures in the ocean (Abbasnia and Soares, 2018; Dafnakis et al., 2020; Paulsen, et al., 2014). On the other hand, these numerical methods are time-inefficient, particularly when the fluid domain is large, structure size is large, multiple bodies interact (multi-body problem), and hydroelasticity is considered. These methods may be inefficient if many simulations are considered in the initial design optimization phase.
An alternative method is to use the Morison equation (Morison et al., 1950), which is used widely for cylindrical objects because of its simplicity and low computational expense (Boccotti et al., 2013; Chen et al., 2015; Jin et al., 2021; Lin et al., 2018). Nevertheless, the equation has fundamental assumptions in that a wavelength is much larger than the structural characteristic length (i.e., a slender body approximation), and the radiation-damping force is not that significant. The Morison equation has inertia, added mass, and drag coefficients. The inertia coefficient denotes the contribution from Froude–Krylov (FK) and diffraction forces, and the representative value of the inertia coefficient for cylinders is two for a slender body (Faltinsen, 1993). The inertia coefficient should be modified if the cylinder is exposed to short waves due to significant diffraction. Many studies have examined the validity of the Morison equation for vertical and horizontal cylinders. For vertical cylinders, Chakrabarti and Tam (1975) investigated the wave forces from MacCamy Fuchs’s analytical solution (potential theory) and the Morison equation for a bottom-mounted vertical cylinder. They introduced the effective inertia coefficient (EIC) by comparing the wave forces from the Morison equation with the analytical solution. The EIC tended to decrease with the Keulegan–Carpenter (KC) number because of the significant diffraction force. Chung (2018) reported that the inertia coefficient could be a function of the wave frequency when the structure is close to the free surface. This means selecting the EIC is critical, and large errors are expected when inputting a representative/theoretical inertia coefficient. Chang et al. (2019) compared results from the numerical wave tank and Morison equation up to second-order wave kinematics for the vertical cylinder and discussed that the Morison equation underestimates or overestimates wave forces as wave steepness is high. In contrast, the overall comparison for low-wave steepness is excellent. For horizontal cylinders, Li et al. (1997) compared the in-line responses of fully submerged cylinders between experiments and the Morison equation, highlighting that the inertia coefficients do not change substantially with regard to the KC number. On the other hand, Chen et al. (2015) compared the Morison equation with a CFD simulation. They reported that a partly submerged horizontal cylinder could induce a large underprediction of the wave force by up to 50% relative errors. Jin (2022) and Jin et al. (2023) showed some differences between inertia forces and wave excitation forces from potential theory observed when the horizontal cylinder is close to the free surface, resulting in a difference in elastic behaviors, especially in short waves. These studies support the importance of correctly selecting the inertia coefficient in the Morison equation for short waves (or high KC numbers).
This study proposes an EIC in the Morison equation in regular and random waves to compare high-fidelity numerical methods and the Morison equation. The OC4 semi-submersible floating offshore wind turbine (FOWT) platform was selected for a feasibility demonstration. The Morison equation can be used to evaluate the hydrodynamic behavior and its effectiveness to some degree (González et al., 2021; Takata et al., 2021). In addition, Kvittem et al. (2012) calculated the EIC by comparing the added mass from potential theory with the added mass term in the Morison equation, showing improvement in the motion response amplitude operator (RAO) of semi-submersible FOWT. Compared to previous research (Kvittem et al., 2012), this study improved the EIC approach in that each column has a separate EIC at various wave periods and directions. This study first assessed the horizontal and vertical wave forces using the Morison equation and potential theory at each column, wave period, and wave direction. An estimation of the EIC under regular and random waves was followed, which minimized the difference between the two methods. The EICs, wave forces, phase angles, and dynamic motions were compared systematically to show the feasibility of an EIC concept under regular and random wave excitations.
2. Configuration of OC4 Semi-Submersible FOWT Platform
Fig. 1 presents the side and top views of the OC4 semi-submersible FOWT platform. Although this FOWT consists of blades, nacelle, tower, floater, and mooring lines, this study only focused on the platform hydrodynamics. The platform has one center column (Column 1), three side columns (Columns 2–4), and slender pontoons and braces. The side columns consist of upper and base columns with different diameters. This study only considered four large columns (Columns 1–4); the others were neglected because pontoons and braces are slender and are typically modeled by the Morison equation. The direct comparison between the potential theory and the Morison equation for Columns 1–4 was possible. The detailed design parameters are not described in this paper and can be found elsewhere (Robertson et al., 2014).
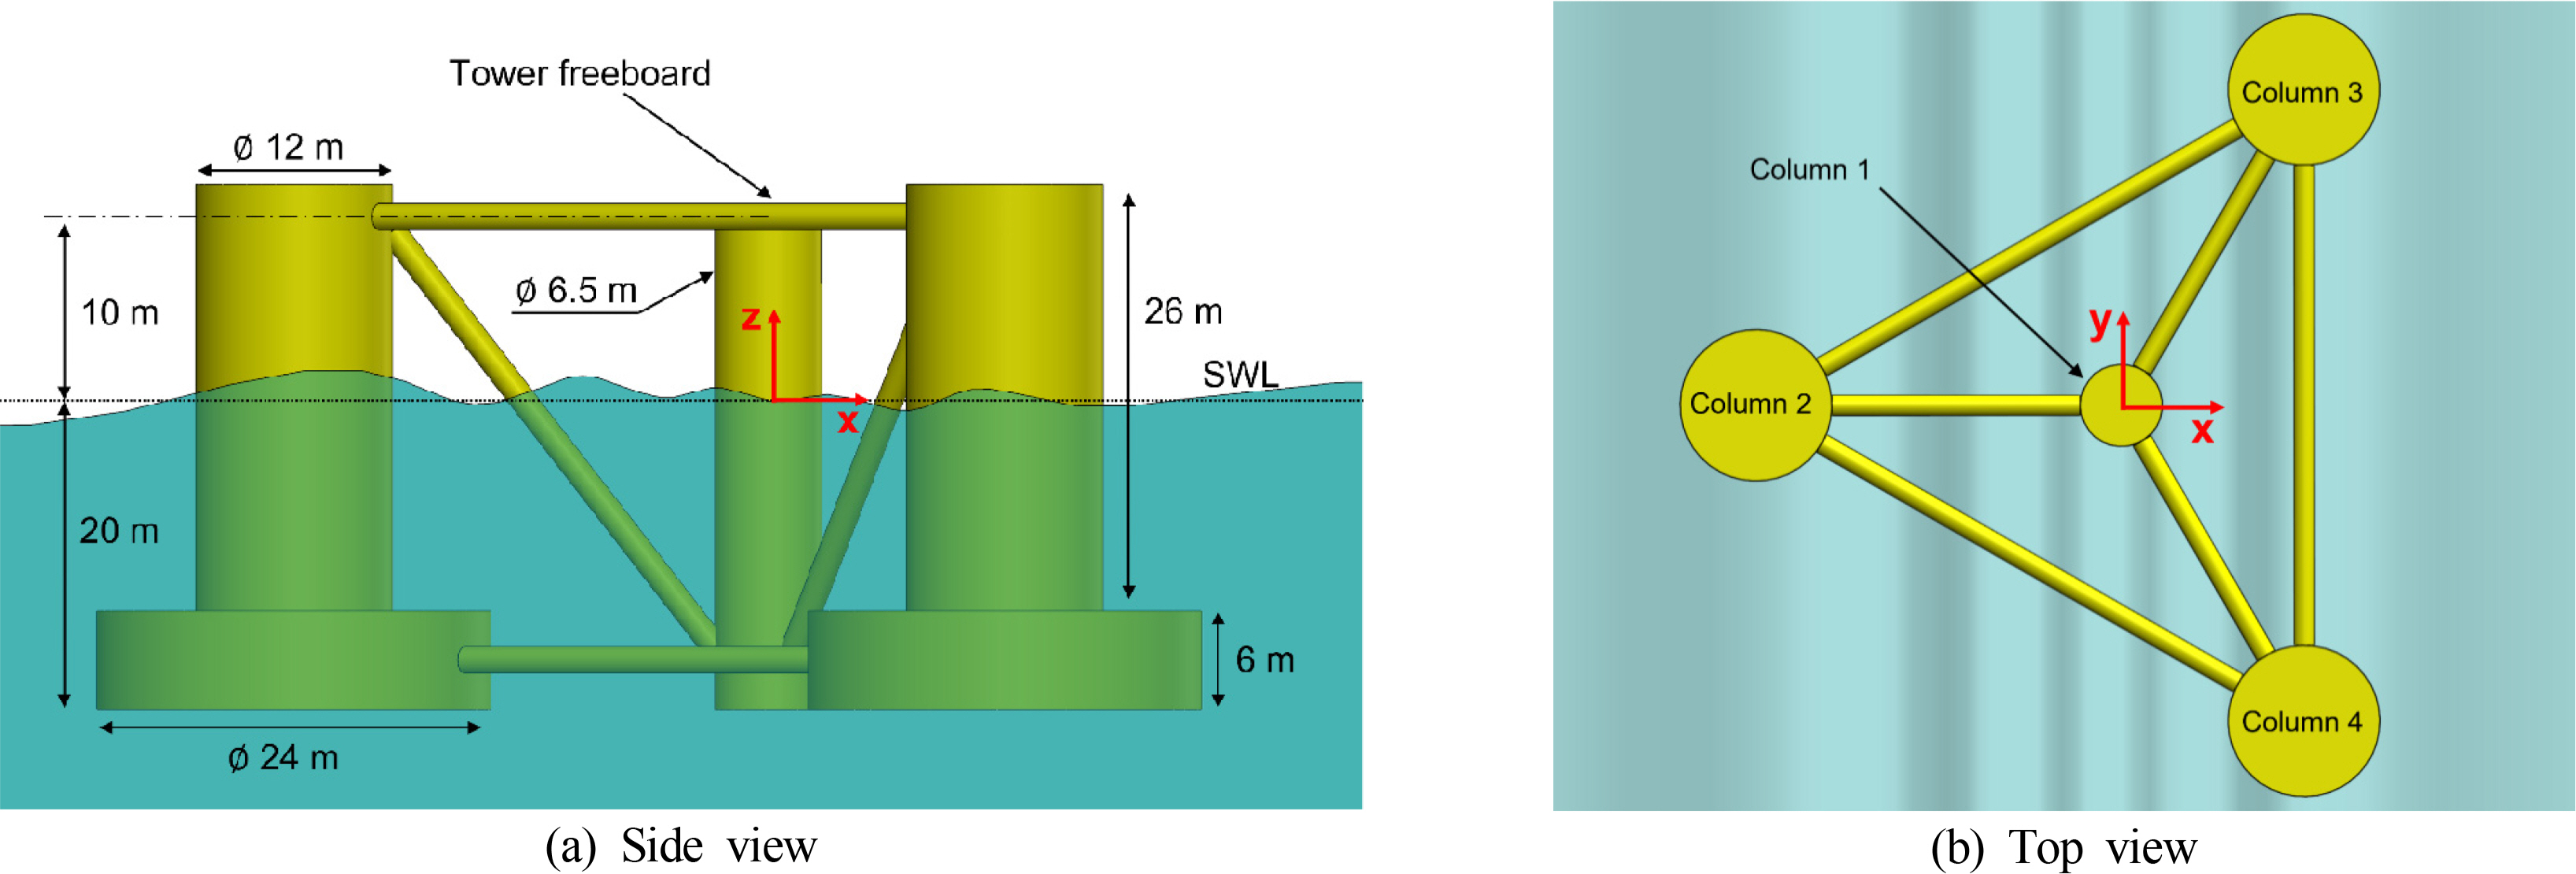
Configuration of OC4 semi-submersible FOWT platform (only four columns are considered in this study).
3. Method
3.1 Morison Equation
The Morison equation (Morison et al., 1950) for a moving body consists of linear inertia, linear added mass, and quadratic drag terms, which can be written as follows:
This study focused on the inertia force FI, which is the first term in Eq. (1). Based on the configuration given in Fig. 1, the way to evaluate FI in the horizontal and vertical direction was different. In the case of the horizontal force, the column was first discretized into 20 elements along the vertical direction (1 m height for each element). The inertia force was calculated at each element with the element volume. The total force of each column was obtained by integrating the element forces. The volume exposed to water only needs to be considered in the case of the vertical force. A correction needs to be made if the top area is not exposed to water like OC4 semi-submersible because the Morison equation considers the body fully submerged in water. For Column 1 (the main column at the center), the inertia force was first estimated at its geometric center (i.e., z = −10 m) using the first term in Eq. (1). This portion was then corrected by deducting the FK force on the top surface because the top surface at the mean water level (i.e., z = 0 m) is not exposed to water. For Columns 2–4, the base columns are only exposed to water in the vertical direction. Therefore, the inertia force was obtained only from the base columns at its geometric center (i.e., z = −17 m). The FK force at the location at which the upper and base columns meet (i.e., z = −14 m) was partly eliminated with the area of the top column. The following equation can be used for horizontal and vertical inertia forces on the column (FIH and FIV):
3.2 Potential Theory in Frequency Domain
Two fundamental equations of potential theory are the Laplace and Bernoulli equations. First, the first-order boundary value problem is solved by Green’s integral equation. In this problem, the governing equation is the Laplace equation, assuming inviscid, incompressible, and irrotational flows. The governing equation is solved with the boundary conditions on the free surface, bottom, body, and far-field, which results in the velocity potentials of incident, diffraction, and radiation waves as follows:
The force is obtained by integrating the pressure over the wetted surface. The wave excitation force is obtained by the incident and diffracted wave pressures as:

Panel model of OC4 semi-submersible FOWT platform.
3.3 Effective Inertia Coefficient in Morison Equation
In the Morison equation given in Eq. (1), the inertia coefficient, CI, is defined as 1+CA where one and CA are related to the contribution from the FK and diffraction forces. In a cylindrical structure, CA is typically set to one, meaning that the contribution from that FK force is the same as that from the diffraction force (Faltinsen, 1993). On the other hand, as described by Chakrabarti and Tam (1975), the total force is significantly affected by large diffraction in short waves, which requires some correction in the inertia coefficient to be well correlated with the wave excitation force. As a result, the EIC was introduced in this study. The horizontal and vertical EICs for each column in regular waves are defined by Eqs. (7)–(8), respectively:
3.4 Time-Domain Equation of Motion for Platform
The time-domain equations of motion for the FOWT platform were established by the Cummins equation and Morison formula given in Eqs. (10)–(11) as follows:
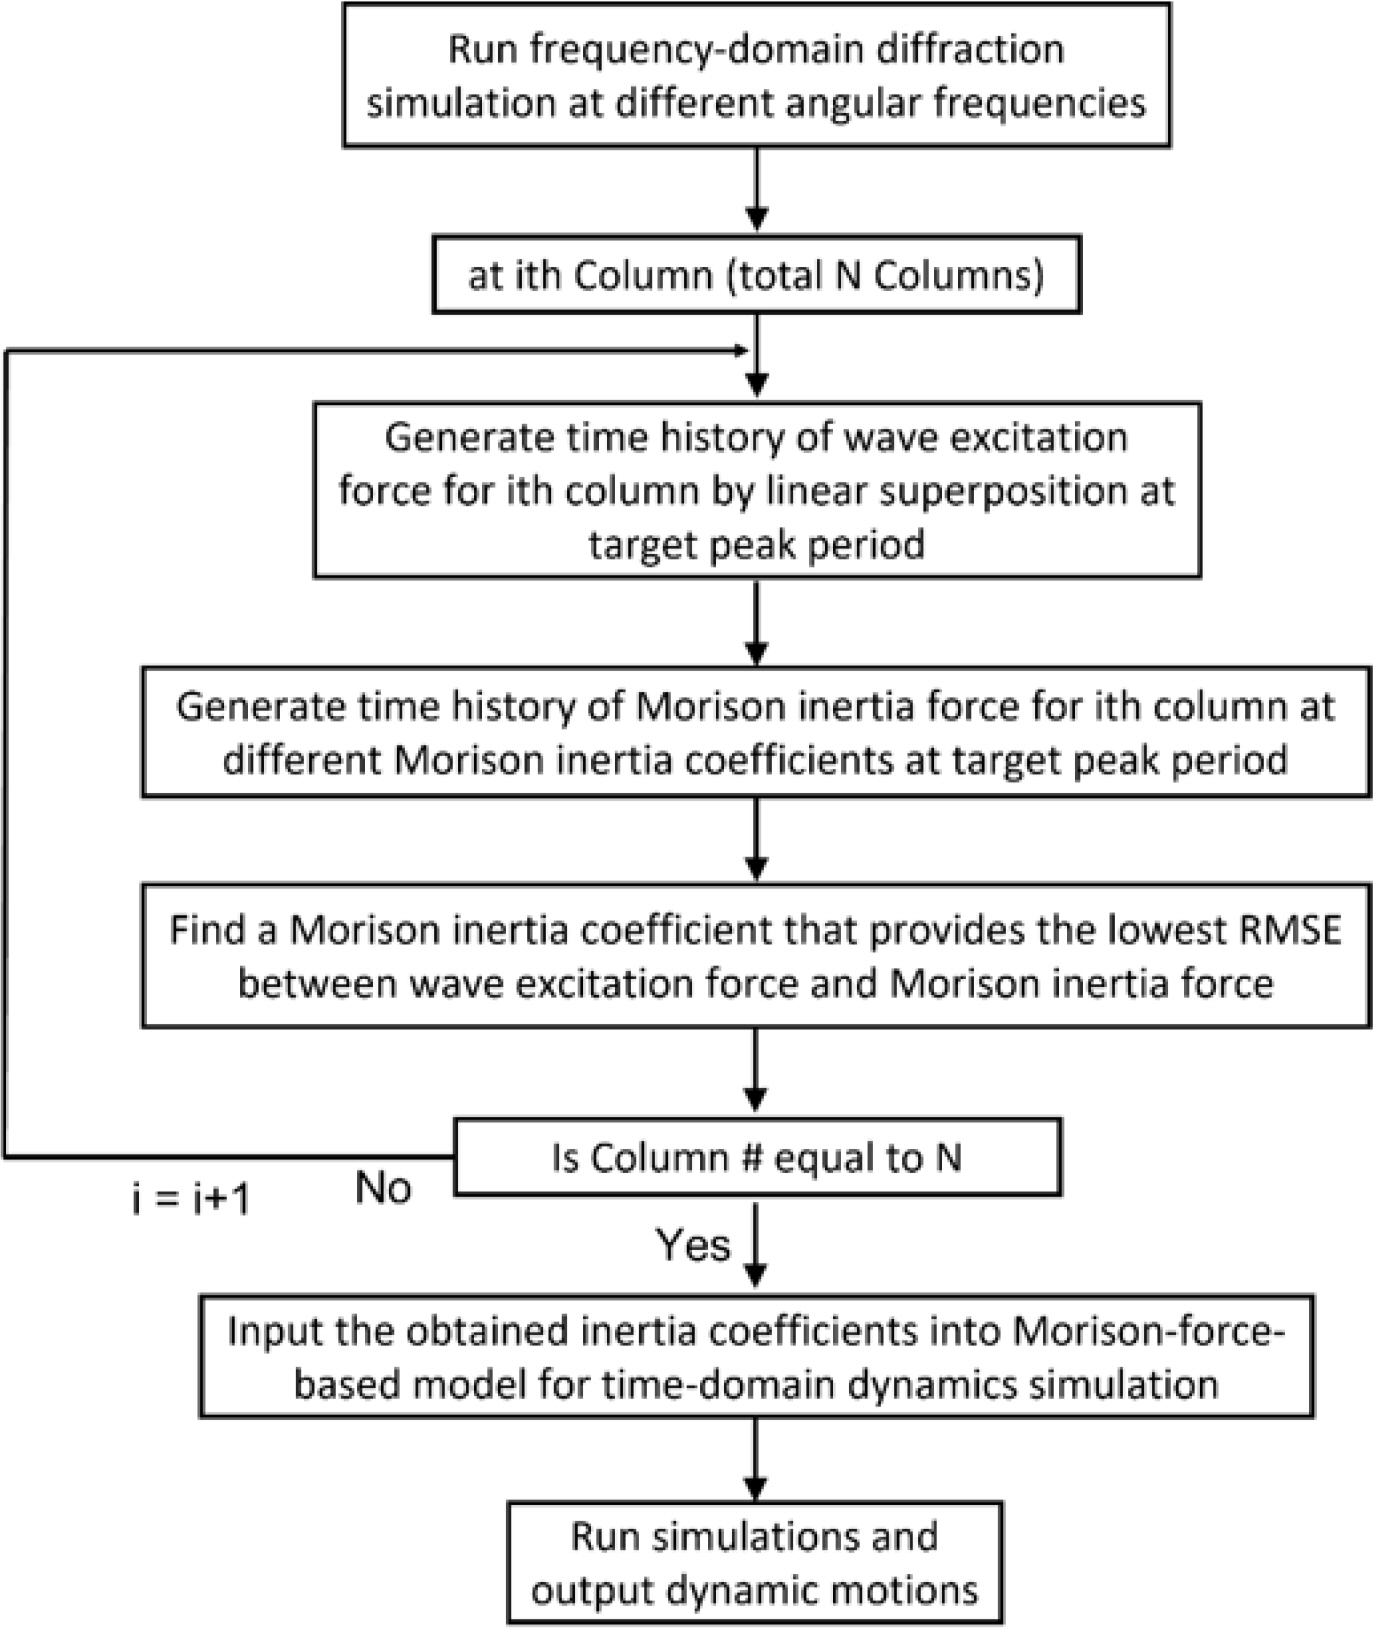
Flowchart of the overall procedures to obtain EIC for the irregular wave cases and run time-domain simulations from the Morison equation-based model.
4. Results and Discussions
The Results and Discussion section compares the wave forces on the OC4 semi-submersible FOWT platform and platform motions obtained by the Morison inertia force and the wave excitation force by the potential theory.
4.1 Wave Force Under Regular Waves
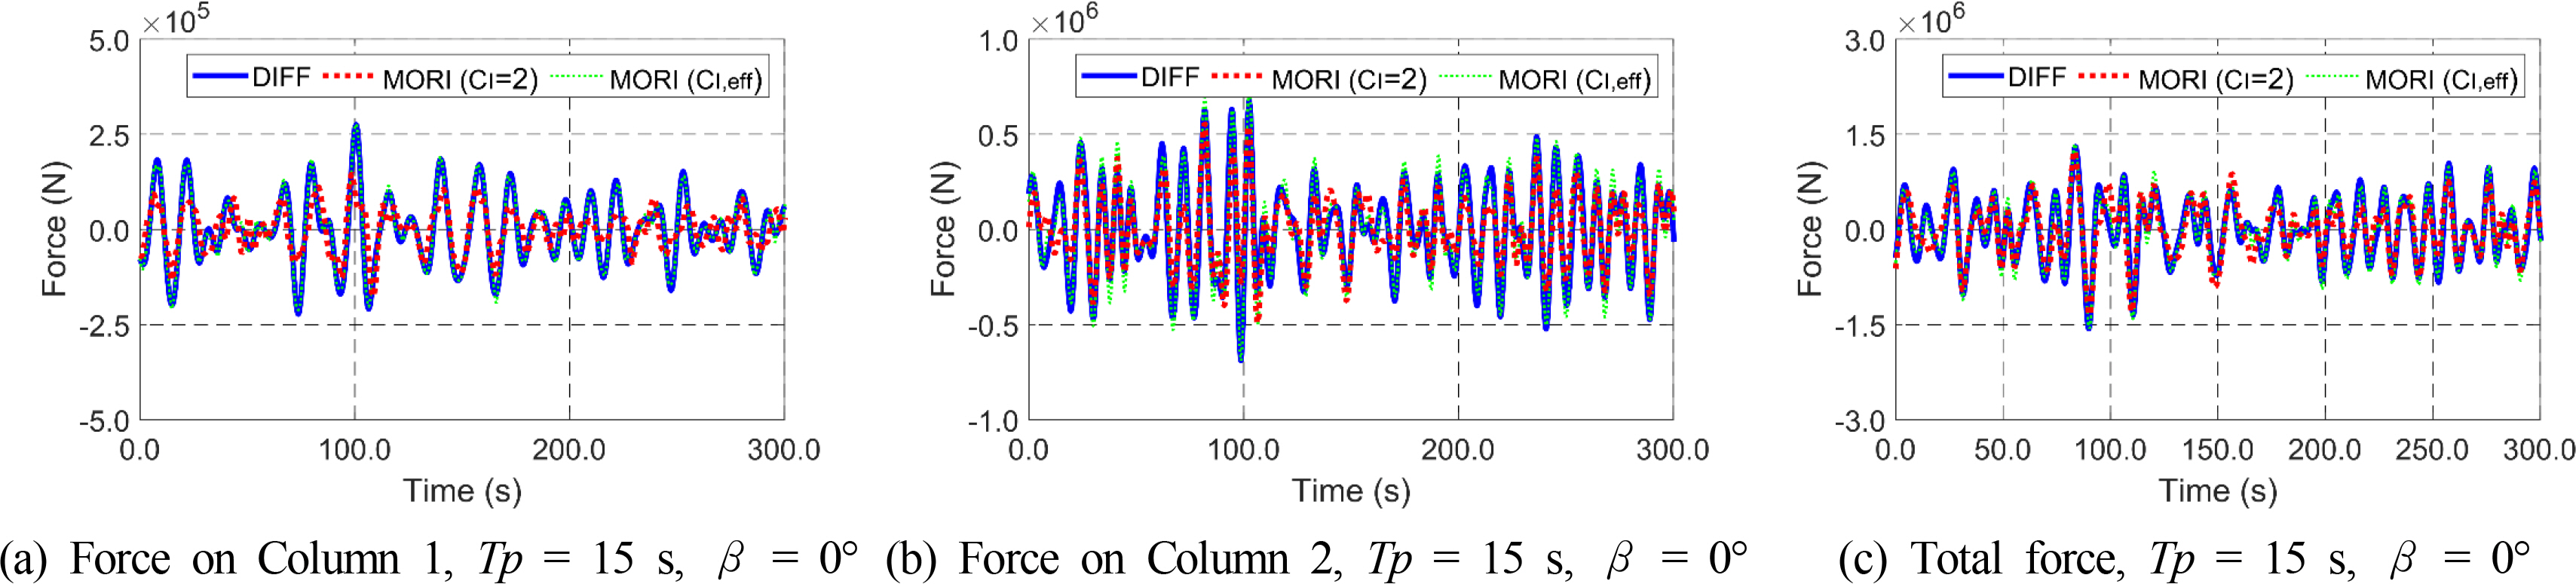
Figs. 4–5 show the total horizontal and vertical excitation forces and Morison inertia forces with a fixed inertia coefficient of two and corresponding phase angles. The total forces were calculated at different regular wave frequencies and directions. The inertia coefficient was fixed to two, a representative value for cylindrical objects. DIFF and MORI in the legends denote components related to the 3D potential theory and Morison equation. As shown in Fig. 4, the magnitudes of the horizontal forces coincide at the wave frequencies of lower than 1.0 rad/s, while the inertia force tends to be exaggerated at higher frequencies because of large diffraction and interaction between columns (i.e., wake effects). Although there is a large difference in the forces in the high-frequency region, the phase angles of the inertia forces are well matched with those of the excitation force. As shown in Fig. 5, the magnitudes and phases of the vertical forces are well matched up to 1.5 rad/s, even if some phase differences are observed in higher frequencies. These results show that if the magnitude of the inertia force is corrected by introducing the concept of the EIC, the Morison inertia force can be a good option for wave force calculation without losing significant accuracy while minimizing the computational cost.
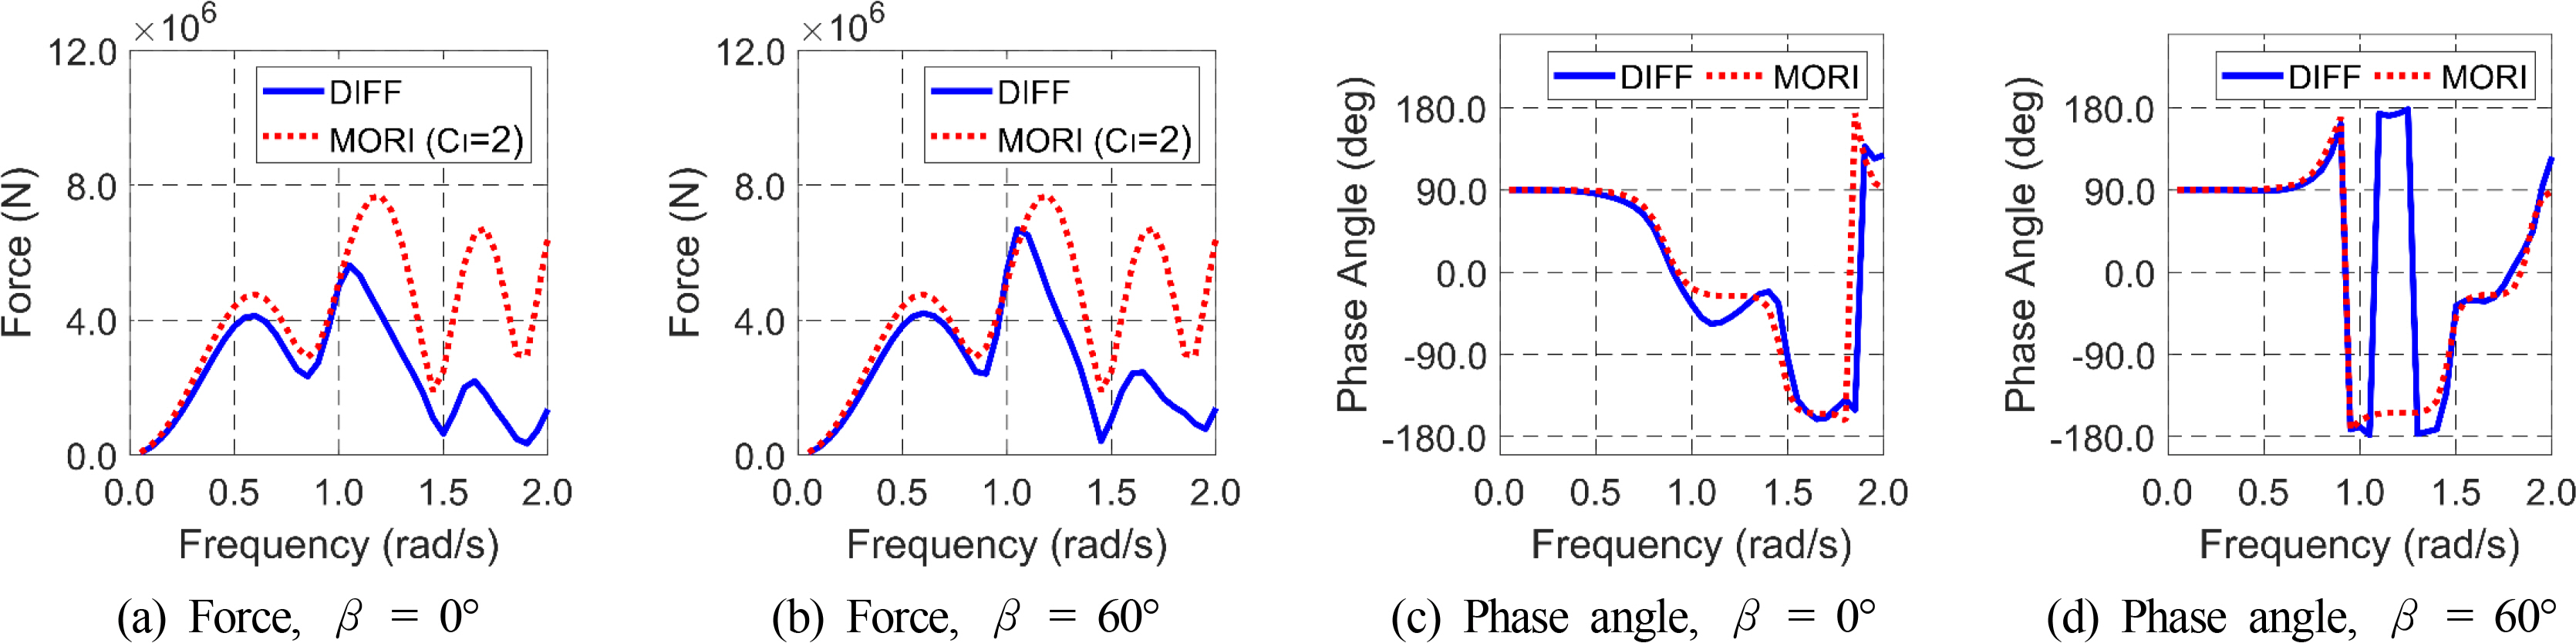
Comparison of the horizontal inertia force (CI = 2) and wave excitation forces and corresponding phase angles at different regular wave frequencies and wave headings.
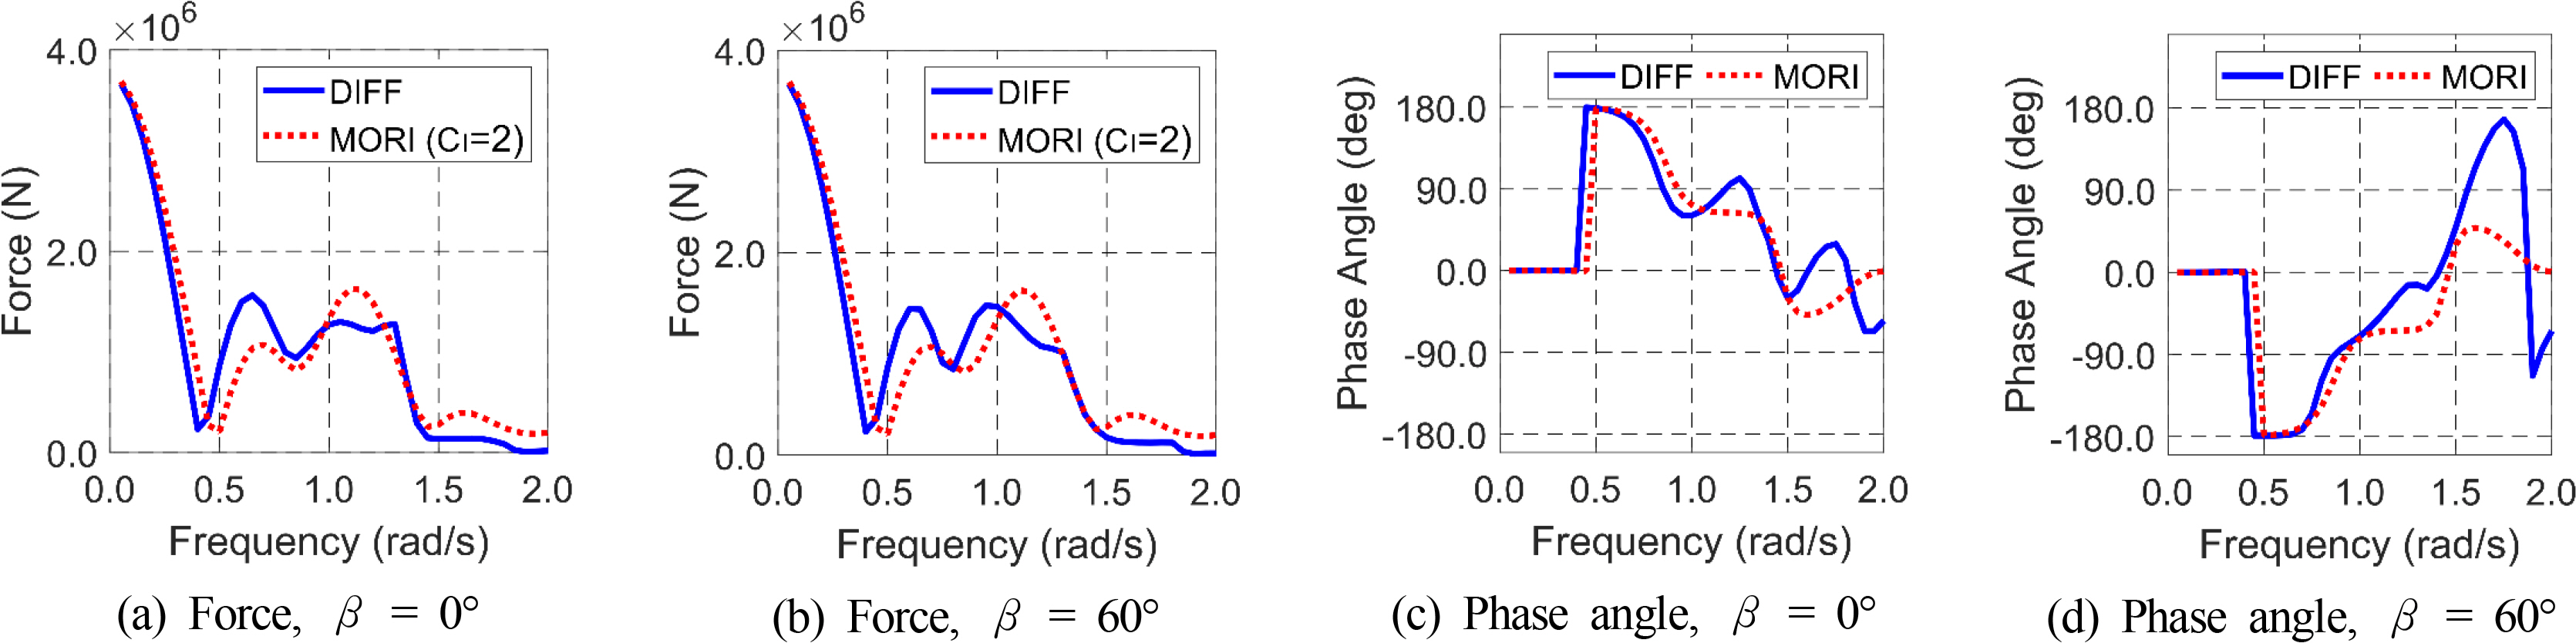
Comparison of the vertical inertia force (CI = 2) and wave excitation forces and corresponding phase angles at different regular wave frequencies and wave headings.
Fig. 6 shows the EICs at different regular wave frequencies and wave directions. In this process, the force of each column obtained by two methods was compared, and the EIC was obtained for each column using Eqs. (7)–(8). C1–C4 in the legends denote Columns 1–4. As shown in Fig. 6 (a)–(b), the horizontal EICs of all columns tend to decrease as the wave frequency increases. As shown in Fig. 6 (c)–(d), the vertical EICs also tend to decrease as the wave frequency increases, except for the central column (Column 1). This is because the inertia force of Column 1 is based on the wave kinematics estimated at the center of the column (z = −10 m), which cannot represent vertical inertia force accurately. Nevertheless, the given method can still result in comparable results by introducing the concept of EIC.
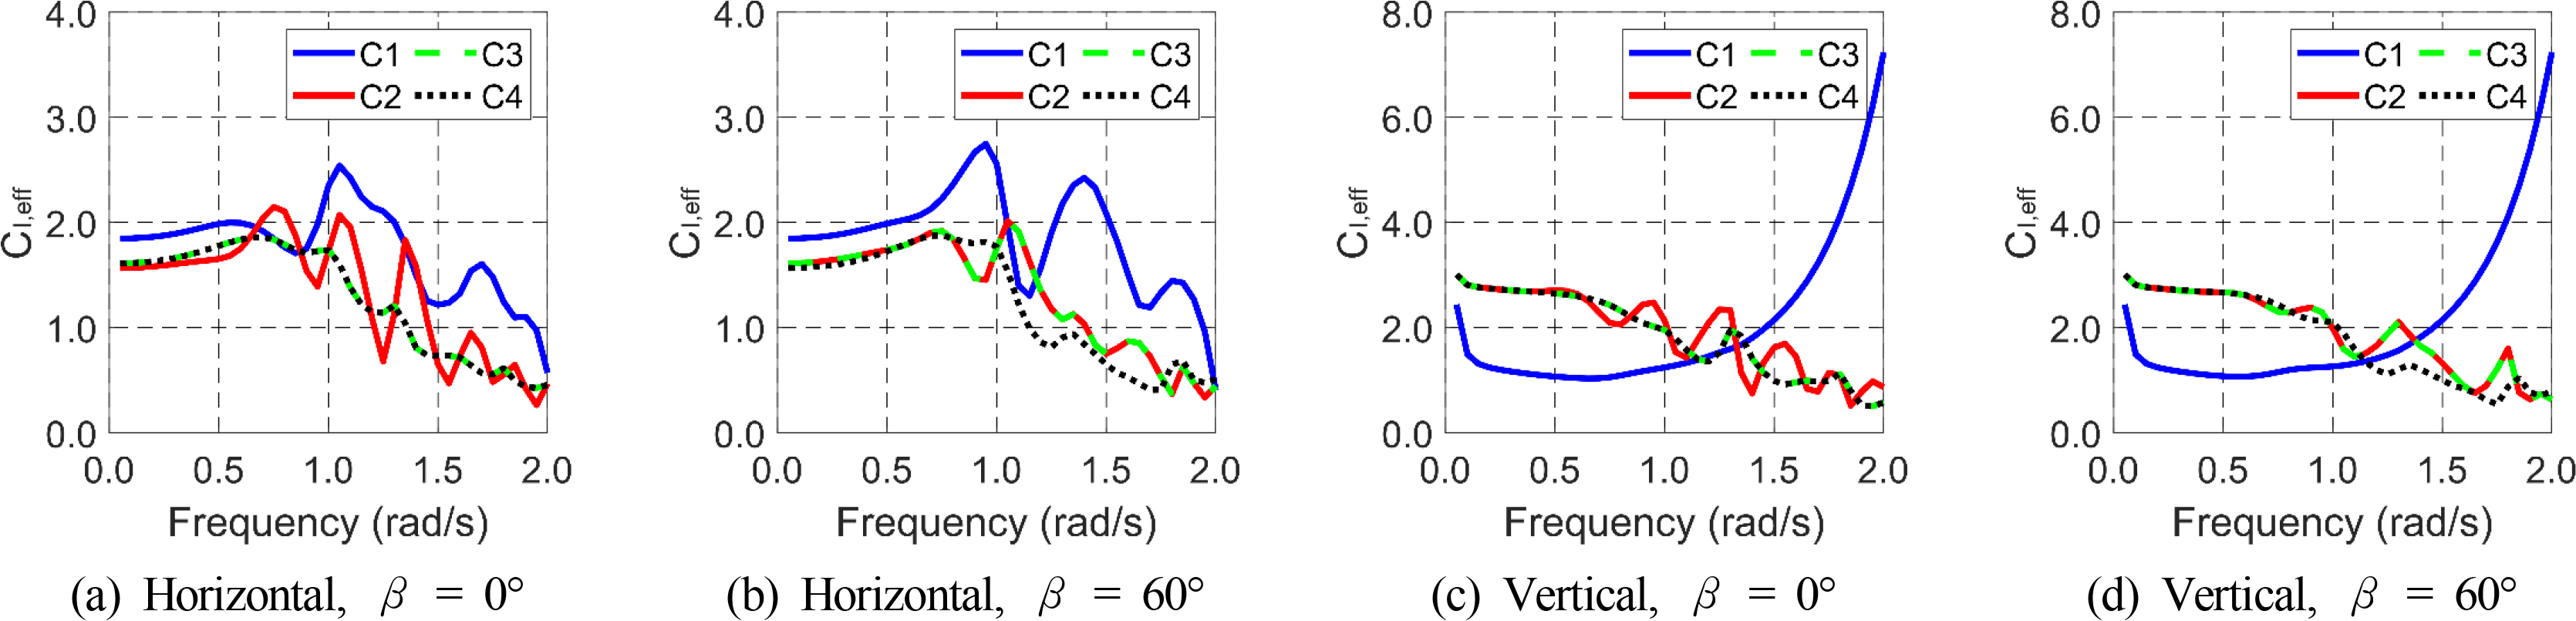
Effective horizontal (a)–(b) and vertical (c)–(d) inertia coefficients (CI,eff) of Columns 1–4 (C1–C4) at different regular wave frequencies and wave directions.
4.2 Wave Force Under Random Waves
Similar comparisons were made under random waves. The time histories of random waves were produced by superposing regular wave components from the PM spectrum, and the time histories of the wave forces were obtained. Figs. 7–8 show the time history comparison of horizontal and vertical wave forces under random waves at different peak periods and wave directions. The wave excitation force, inertia force with a fixed inertia coefficient of 2, and the inertia force with the EIC obtained by Eq. (9) were compared. In addition, a three-hour simulation for each wave condition was considered to acquire EIC, and the time histories of the first 300 s are only presented for a better time-history comparison. As shown in Fig. 7, for the horizontal force, a representative inertia coefficient of 2 was sufficient when the peak period was large (i.e., 15 s) and the wave direction was 0°. On the other hand, a significant overestimation in force was observed in the inertia force with a representative inertia coefficient at a low peak period (i.e., 6 s) and wave direction of 60°. This overestimation was corrected using EIC. With EIC, the time history of the inertia force showed good agreement with that of the wave excitation force. As shown in Fig. 8, similar correction effects were also valid for the vertical wave forces because the EIC significantly reduces the error between the two methods. In addition, estimating the EIC using RMSE between the wave excitation force and the Morison inertia force was acceptable.
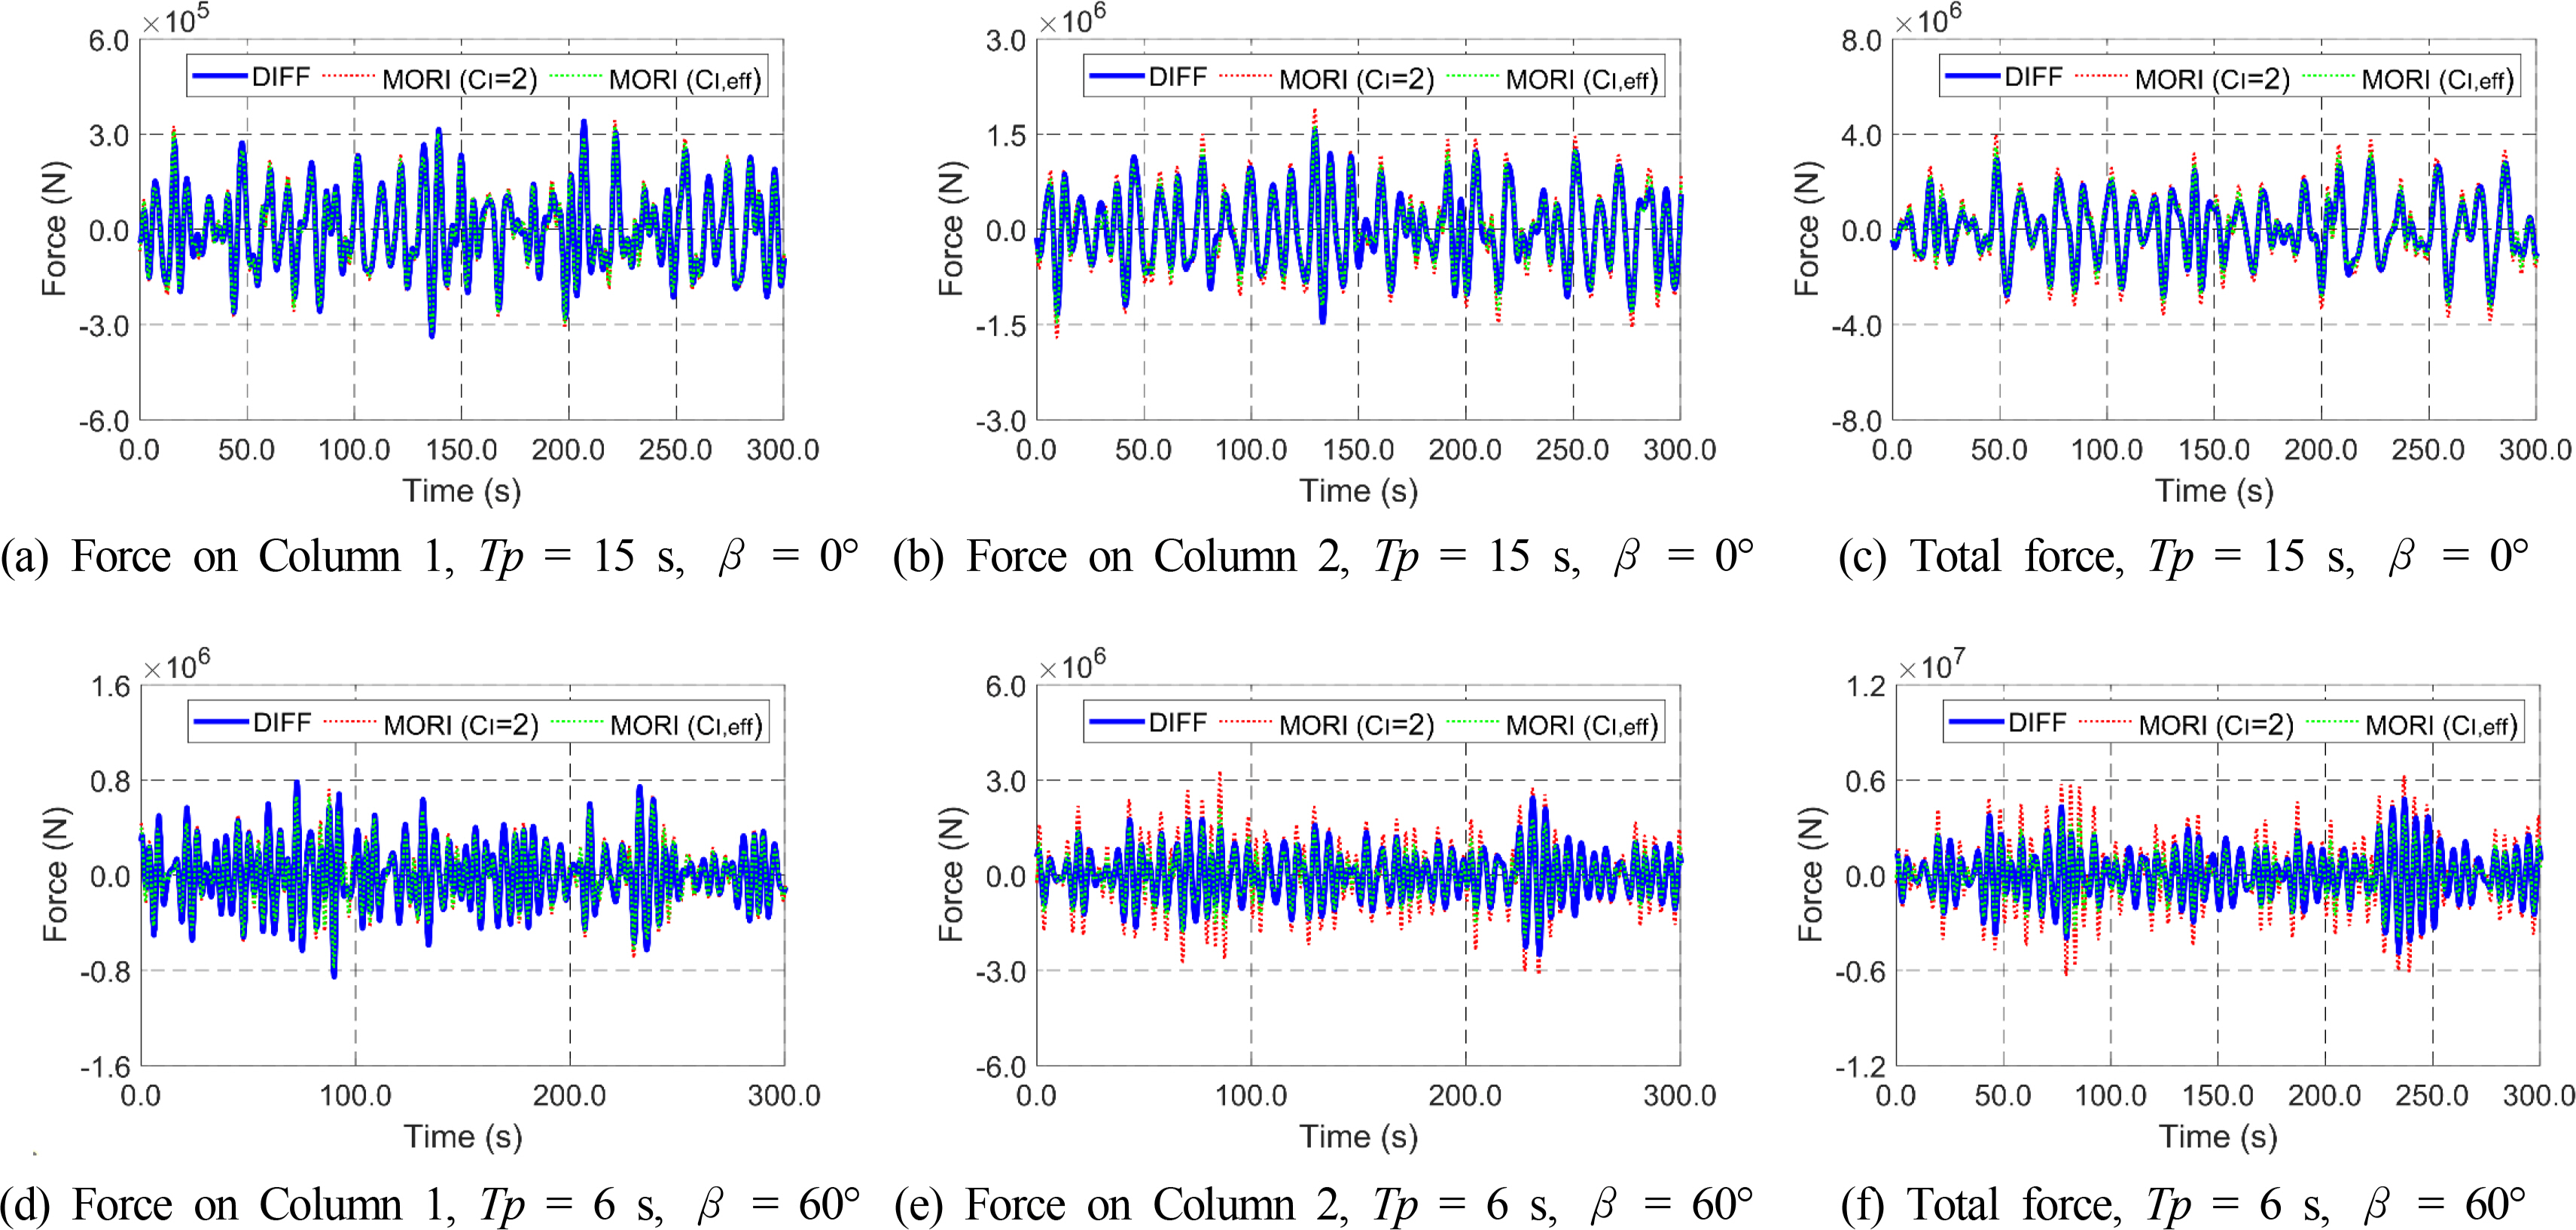
Time histories of the horizontal inertia forces from the Morison equation and wave excitation forces from potential theory at different peak periods and wave directions.
Time histories of the vertical inertia forces from the Morison equation and wave excitation forces from potential theory.
Fig. 9 shows the EICs under random waves at different peak periods and wave directions. The trends and magnitudes are similar to those in Fig. 6 under regular waves. The EICs under random waves show more smothered results. This makes sense because random waves consider many frequency components.

Effective horizontal (a–b) and vertical (c–d) inertia coefficients (CI,eff) of Columns 1–4 (C1–C4) under random waves at different peak periods and wave directions.
Fig. 10 summarizes the errors of inertia force. The error was calculated by comparing the percentage difference between the standard deviation of the wave excitation force and that of the inertia force with EIC. Some errors up to 24.94% at a peak period of 6 s and wave direction of 45° were obtained for horizontal wave force. On the other hand, the errors in the horizontal force were reduced significantly as the peak period increased. For example, the errors at a wave heading of 60° decreased to 6.15% and 0.26% at peak periods of 8 s and 15 s. Regarding the vertical force, the error is within 10% regardless of the peak period and wave direction.

Error of the horizontal (a) and vertical (b) inertia forces at different peak periods and wave directions (the values are interpolated).
4.3 Dynamic Response of Platform Under Random Waves
Sections 4.1–4.2 show the feasibility of the EIC concept. The method can be used for fixed cylindrical structures because the horizontal and vertical forces are correctly estimated by correcting the inertial forces in the Morison equation. In Section 4.3, the EIC concept was further checked for floating structures by comparing the motions between the two methods. A commercial time-domain dynamics simulation program, OrcaFlex, was used to obtain the dynamic motions of the OC4 semi-submersible FOWT platform. The models based on diffraction theory and the Morison approach were established separately, as expressed in Eqs. (10)–(11). Each column was discretized into 1-m elements in the Morison approach, and the Morison inertia coefficient was inputted separately. Note that each column has the same inertia coefficient. The pressure correction in vertical force, PIAT in Eq. (3), was inputted as an external force after precalculation. For a moving body, an added mass coefficient needs to be inputted, which was obtained by subtracting one from the obtained inertia coefficient (i.e., effective added mass coefficient). In the comparisons, only heave, roll, and pitch degree-of-freedom (DOF) motions were considered, while the other DOF motions were constrained because the mooring lines were not modeled. In this demonstration, 10% damping was considered in the heave, roll, and pitch DOFs, which excludes the influence of added mass because the effective added mass coefficient varies according to given environmental conditions. A time-domain simulation was conducted with a simulation time of one hour with a fixed time interval of 0.1 s. Random waves were generated by superposing 200 regular waves from the Jonswap wave spectrum with an enhancement parameter of two. In addition, the computational time of the Morison-equation-based model was approximately 25% faster than the Cummins-equation-based approach. On the other hand, it can vary depending on the division of the Morison element. In the present case, 1-m elements were used for Morison force calculations, which is considered acceptable. The Morison equation can be much more time-efficient if the proper element size is selected.
Figs. 11–12 show the time histories and spectra of heave and pitch motions based on models with the Morison equation and potential theory at different peak periods. In this demonstration, the wave heading was fixed to 0°. When the peak period was 15 s, a large discrepancy was observed between heave motions based on the Morison equation with a fixed inertia coefficient of two and diffraction theory, which is corrected by the EIC concept. The pitch motion of the current model is based primarily on the surge force, which results in a good comparison regardless of the inertia coefficient correction. At a peak period of 6 s, however, moderate differences were observed in both heave and pitch motions. Various coupling effects were observed in the model with Morison force because the Morison equation considers instantaneous positions instead of a fixed location for kinematics calculations as in potential theory. Although there is no wave energy at the lower frequency region, the pitch spectra at a peak period of 6 s showed a low-frequency peak at the pitch natural frequency only from Morison models. A thorough study still needs to validate the EIC concept under different wave conditions and floating structures. The Morison equation can also be extended to include second-order wave inertia forces, as reported by Kim and Chen (1994).

Time histories of the heave (a)–(b) and pitch motions (c)–(d) based on models with Morison equation and potential theory at different peak periods.
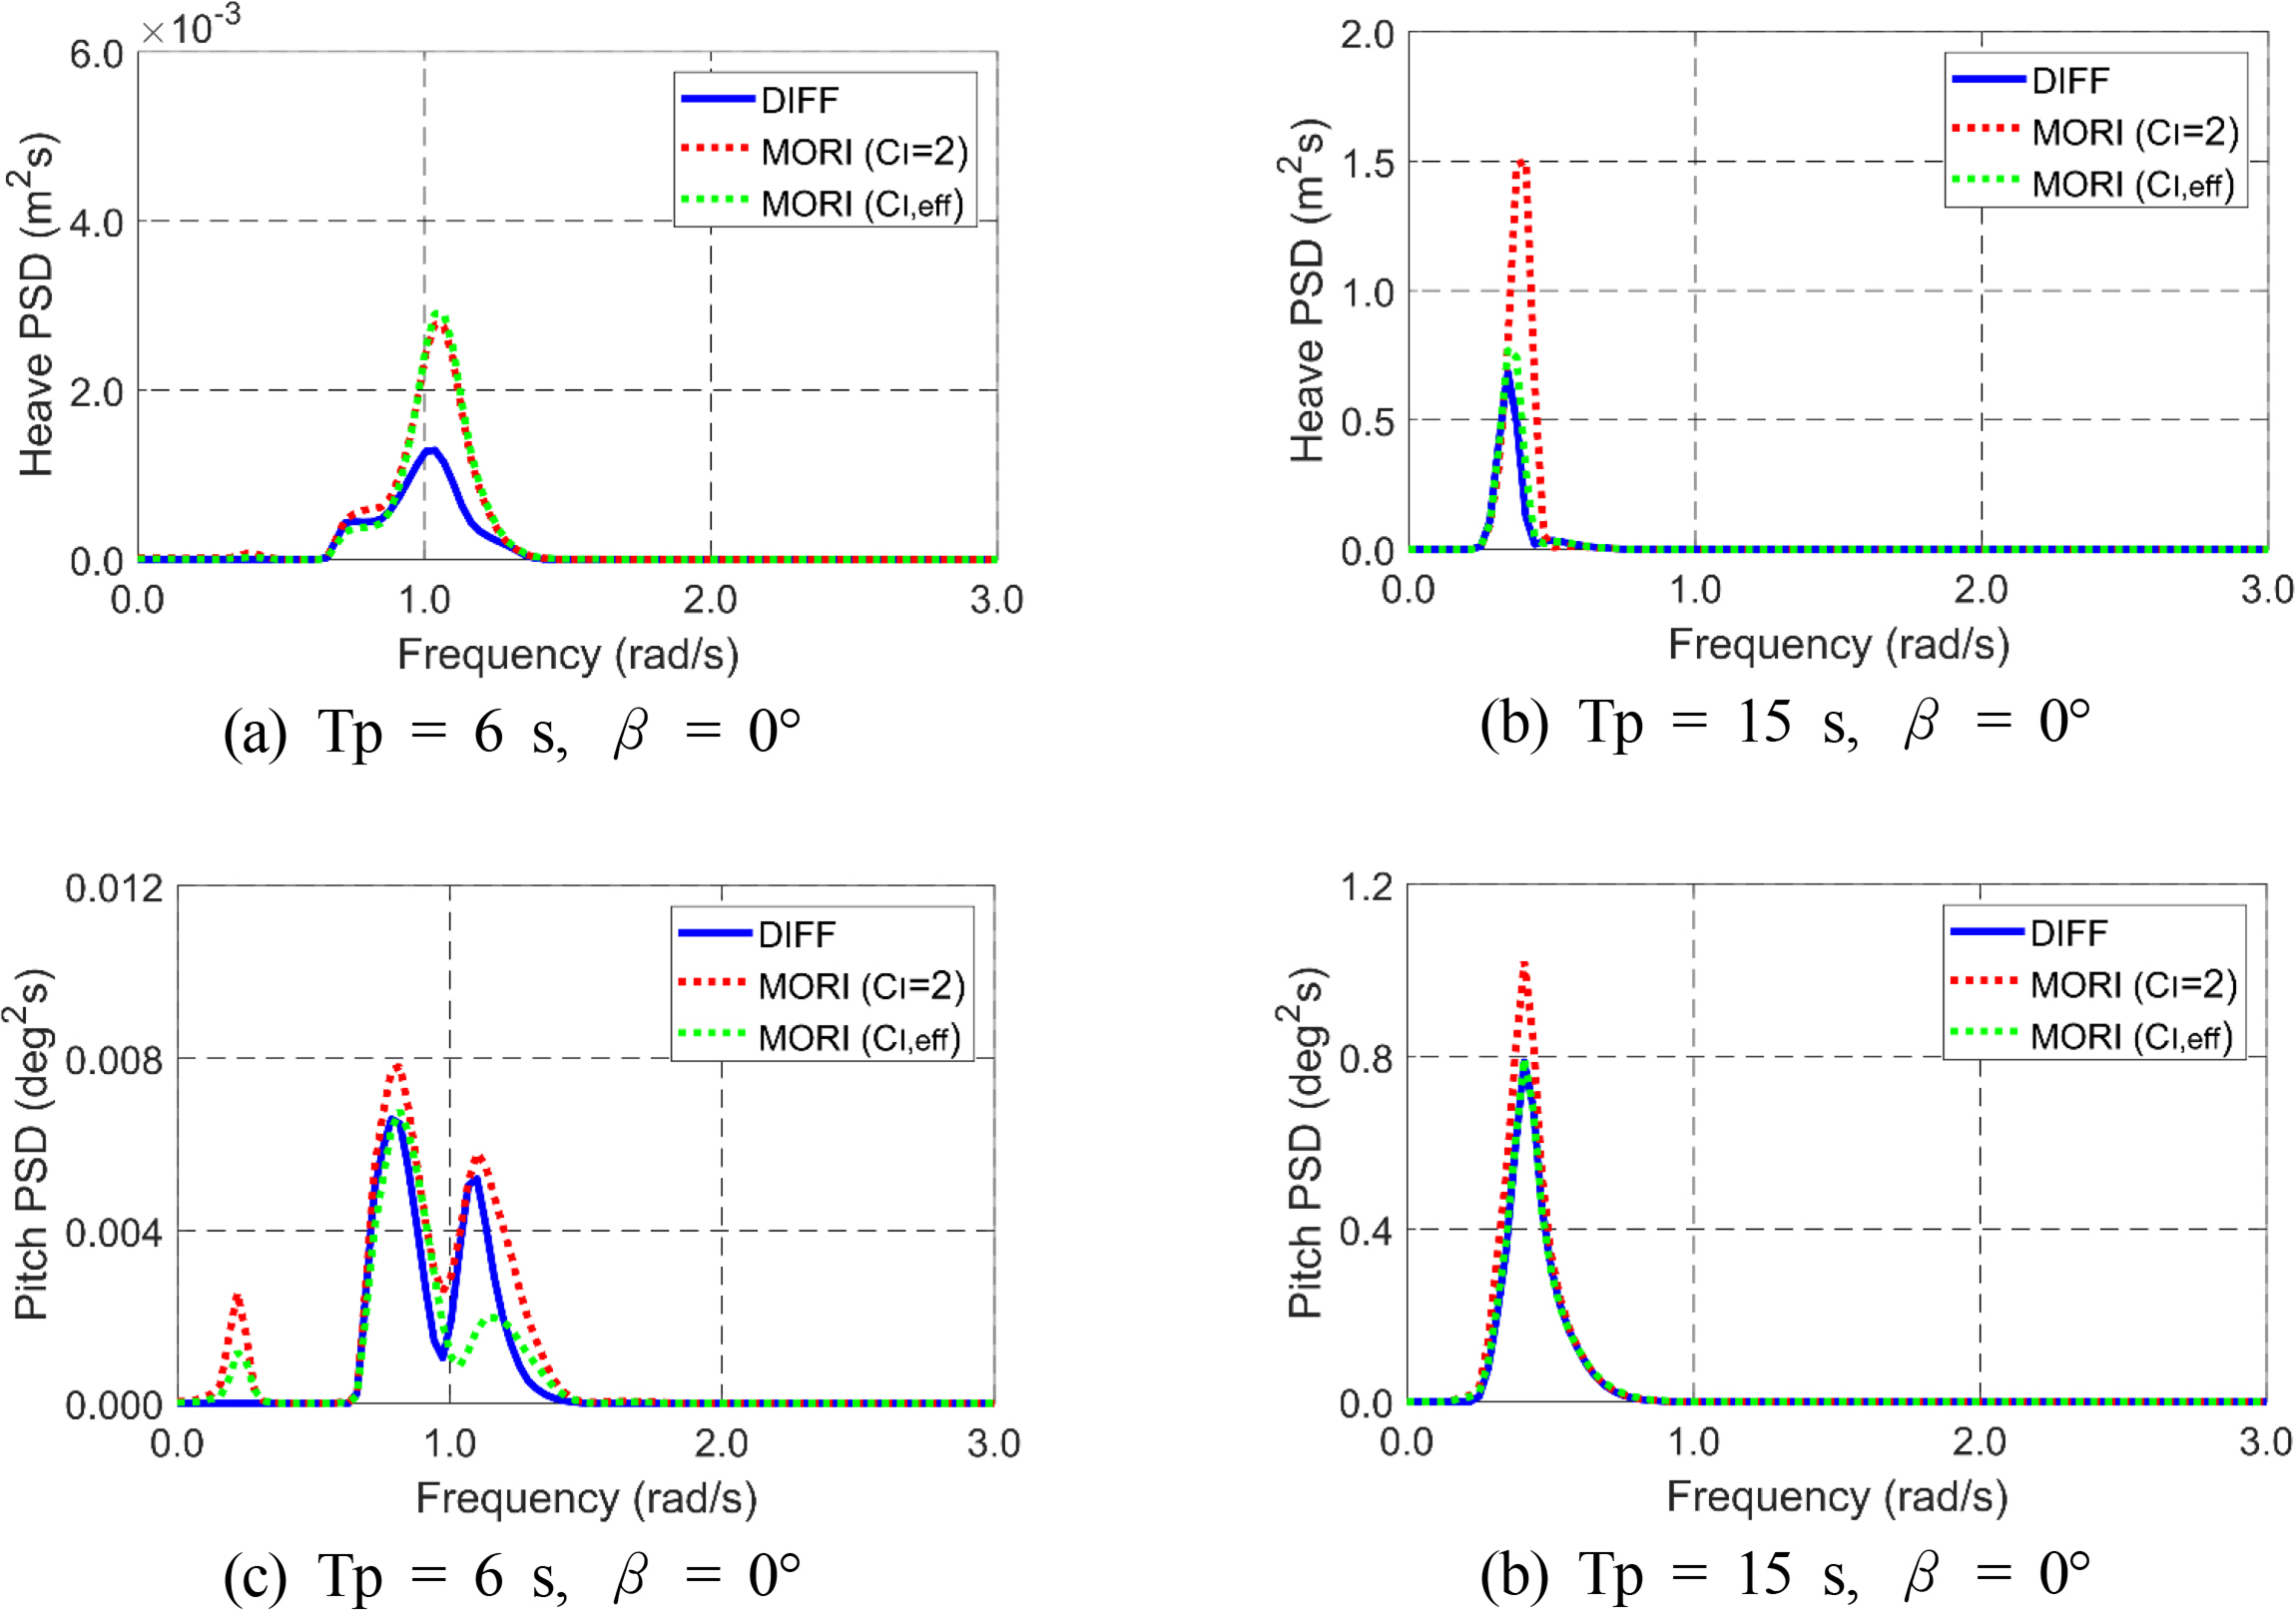
Spectra of the heave (a)–(b) and pitch motions (c)–(d) based on models with the Morison equation and potential theory at different peak periods.
5. Conclusions
This paper introduced the concept of EIC in the Morison equation to make a better estimation of the wave forces and platform motions through the Morison equation. The OC4 semi-submersible FOWT platform was considered. The EIC was estimated by comparing the wave excitation force by potential theory and inertia force using the Morison equation. Various regular and random waves at different periods and directions were considered. First, horizontal and vertical (surge and heave) wave forces were assessed at various regular wave frequencies. Large errors in the horizontal force were observed with a fixed inertia coefficient of two. The errors tended to increase when the wave direction and wave frequency increased, and the EIC decreased the discrepancy between the two methods. Although similar trends were observed under random waves to regular waves, a smoother EIC was obtained because it considers many wave frequency components. The adoption of EIC reduces the difference between the two forces significantly. The OC4 platform motions were then compared under wave forces using two methods. The motion comparison results show acceptable agreement at the longer wave case. These results show that the concept of EIC can play some role in mass simulations in the early design stage to provide a range of design parameters quickly so that the design optimization can be done in a time-efficient manner. A rigorous study still needs to be carried out under various wave conditions and other floating structures to assess the feasibility of the EIC concept.
Notes
Chungkuk Jin and MooHyun Kim serve as editorial board members of the Journal of Ocean Engineering and Technology, but they had no role in the decision to publish this article. No potential conflict of interest relevant to this article was reported.