Experimental Investigation of Local Half-cone Scouring Against Dam under the Effect of Localized Vibrations in the Sediment Layers
Article information
Abstract
Most natural river reach are approximately balanced with respect to sediment inflow and outflow. Dam construction dramatically alters this balance, creating an impounded river reach characterized by extremely low flow velocities and efficient sediment trapping. The impounded reach will accumulate sediment and lose storage capacity until a balance is again achieved, which would normally occur after the impoundment has become “filled up” with sediment and can no longer provide water storage and other benefits. This paper aims to investigate the sediment removal process in dam reservoir using simultaneously pressure flushing operation and vibrator machine. The main objective of this study is to identify the effect of vibrator in flushing cone dimensions. To achieve the objectives of present study, laboratory test have conducted under different hydraulic conditions such as two bottom outlets with diameter equal to 2” and 3”, five discharges 0.23, 0.53, 1.21, 1.53 and 2.1 lit/s and only one water depth above the center of bottom outlets. Using the vibrator machine mounted into the reservoir and close to the bottom outlet, different frequency e.g. 20, 35 and 50 HZ, have been introduced to the deposited sediment at the vicinity of outlet. The results indicate that the volume and width of flushing cone are strongly affected by frequency of vibrations. The results indicate that the volume and width of flushing cone are strongly affected by frequency of vibrations.
1. Introduction
Many type of sediment-related problems can occur both upstream and downstream of dams, and sediment entrainment can also interfere with the beneficial use of diverted water. Sediment can enter and obstruct intakes and greatly accelerate abrasion of hydraulic machinery, thereby decreasing its efficiency and increasing maintenance costs. Turbid density currents can carry sediments tens of kilometers along the bottom of the impoundment, eventually entering deep intakes and accumulating in front of low level outlets. Localized sediment deposits in the delta region and streambed aggradations upstream of the reservoir can produce flooding, because soil water logging and salinization, impair navigation, alter ecological conditions, inundate powerhouses discharging into delta areas, and bury intakes (Fig. 1). In arid regions the growth of phreatophyte vegetation on delta deposits can significantly accelerate water loss. The combination of sediment trapping and flow regulation also has been used dramatic impacts on the ecology, water transparency, sediment balance, nutrient budgets, and river morphology downstream of the reservoir; dam construction is the largest single factor influencing sediment delivery to the downstream reach. Storage loss is but one of many sedimentation problems that can affect reservoirs. Operation of storage reservoirs is severely impacted by the time half the volume has been deposited, but severe sediment-related problems can appear when only a small percentage of the storage capacity has been lost. As reservoirs age and sediments continue to accumulate, sediment-related problems will increase in severity and more sites will be affected. At any dam or reservoir where sustainable long-term use is to be achieved, it will be necessary to manage sediments as well as water. This is not a trivial challenge.
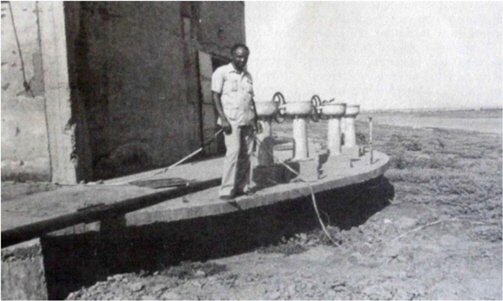
Sedimented water supply intake in the delta region upstream of Khasm El GirbaDam on the Atbara River, Sudan (R. Hotchkiss)
Based on the inventory published by the International Commission on Large Dams (ICOLD, 1988) and the current rate of dam construction, as of 1996 there were about 42,000 large (over 15 m tall) dams worldwide. Pressurized flushing has been studied extensively in the literature (White and Bettess, 1984; Shen et. al., 1993; Shen and Lai, 1996; Scheuerlein et. al., 2004; Emamgholizadeh et. al., 2006) and Meshkati Shahmirzadi(2010). In spite of advances in the investigation of pressure flushing technique at reservoir storage, studies about the effect of bottom outlet diameter on flushing cone development are limited and more information about this phenomenon is needed. One of the most effective techniques is flushing through which the deposited sediment is hydraulically removed by the flow. The oldest known method of flushing, practiced in Spain in the 16th century, was referred to by D’Rohan (Brown, 1943). Traditional approaches to sediment management have not considered the need for sustained use. Large initial storage volumes and erosion control have traditionally been recommended to reduce sediment inflow and delay the eventual “death” of reservoirs, but erosion control alone cannot achieve the sediment balance required to stabilize reservoir storage capacity and achieve sustainable use. Furthermore, many erosion control programs are poorly conceived and implemented, and fail to achieve the desired reductions in sediment yield. As a result, reservoirs worldwide are losing storage capacity rapidly, possibly as fast as 1 percent per year (Mahmood, 1987).
Extensive treatments of these topics are already available by others (Yang, 1996; Simons and Senturk, 1992; Julien, 1995; Chang, 1988; Vanoni, 1975; Graf, 1971). Rather, Sedimentation problems and management techniques vary widely from one site to another, and by studying specific sites one can appreciate the complexity of sediment problems and the manner in which they can be addressed.
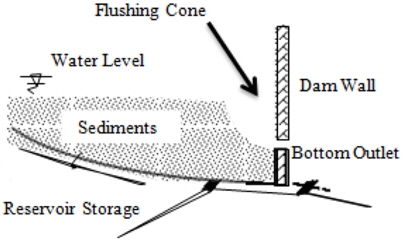
Longitudinal and plan view of flushing half-cone in vicinity of bottom
In streams where most or all sediments are sands, the sediment can be settling in an Imhoff cone, and the sediment content expressed as milliliters per liter. This method is useful in monitoring sediment release events because results can be obtained after short settling time, on the order of 1 min. Moreover, dimensions of flushing cone are also effective on rescue of power plant intakes. This paper deals experimentally with pressure flushing phenomena and investigation about the effect of bottom outlet cross section on volume and dimensions of flushing cone. The results are tabulated in terms of statistical measures and also illustrated in the scatter plots. However, this method requires that a calibration curve be constructed for each site where this method is used, to develop a relationship between settled sediment volume and sediment mass. During every event when this method is used, several samples should be collected and analyzed in a laboratory to confirm the original calibration. Because the grain size distribution can change significantly over the course of an event, it is also important that samples be taken at different periods as the calibration curve may shift during an event. In addition to speed, this method has the advantage of simplicity in equipment and procedure.
Estimation of sediment volume removed or volume of flushing cone in this technique with vibrations on a vibrator machine in layers of sediment is important for designing bottom outlet gates, in which the optimum and the best frequencies can be designed with respect to the cross section. Researches for understanding the geometric variations of scouring cone with the cross section change of the bottom outlet are necessary in order to make a rational design for the bottom outlet. Designing the bottom outlets must be through an optimization between some important rules (stipulations) such as: gate cost versus economic value of the increased reservoir volume after flushing. Dimensions of flushing cone are also effective on rescue of power plant intakes. Moreover, in the planning of dam operation, it can be vital to assess how much of the sediment can be removed, and how much flushing water is required. This paper deals experimentally with pressure flushing phenomena with vibrations on a vibrator machine in the layers of sediment in different frequencies and investigation about the effect of bottom outlet cross section on volume and dimensions of flushing cone.
2. MATERIALS AND METHODS
2.1 Experimental arrangements
The experiments were conducted at hydraulic laboratory of Shiraz University. Experiments tests carried out on hexahedral shallow basin whose overall dimensions consist of 7 meter length, 1 meter wide and 1 meter height. Using two reticulate sheets at the reservoir’s entrance, a smooth flow is created. The front wall of model will be easy to change to modify different cross sections of reservoir bottom outlets. The outlets of main reservoir include two different gate valves with diameter of 2.54 and 5.08 cm. The sediment deposits at the main reservoir was consists of silica particles with uniform size distribution, with a median diameter of d50 =1 mm and geometric standard deviation of σ=1.25. Adjacent to the reservoir, an underground tank as well as a pump was used to prepare and recirculate the desired inflow water discharge which named water supply system. Water supply system of model was also supported by an adjusting valve, a digital flow-meter, and an 11- meter flume upstream of model. Along the basin side walls, a movable frame was mounted to carry the measuring instruments. After each experiment, the scour cone configuration was measured by a digital point gage device.
For the downstream section it was use another stilling basin which the mixing flow of water and sediment was collect in it and through a plastic pipe in a closed circuit with the under ground tank. The settling basin was a rectangular flume of 4 meter long, 1 meter wide, and 1 meter height. At the end of settling reservoir there was a V-notch weir (with angle of 90°) to measure of outflow discharge. In Fig. 3 a schematic plan view of the experimental setup and the hydraulic circuits is given. The notation of flushing half- cone under a discharge of 2 l/s, water depth of 80 cm and 5.08 cm diameter of the outlet are illustrated in Fig. 4.

Schematic plan view of the experimental setup and its hydraulic circuits
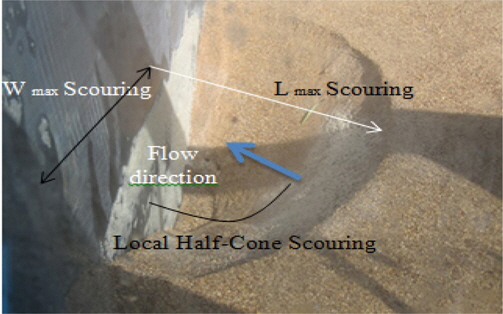
Local Half-cone scouring at the vicinity of bottom outlet in frequency (0 HZ)
Position of a vibration machine a plan longitudinal profile are illustrated (Frq=20, 35 and 50 HZ) in Fig. 5, Fig. 6.

Plan the position of a vibration machine
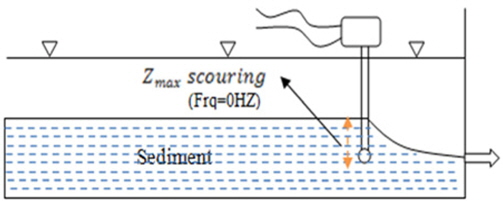
Longitudinal profile the position of a vibration machine
The vibrator is provided with a built-in converter in the switch box that converts the frequency 10 Hz to 50 Hz, and 1-phase 220 V to 3-phase 210 V which runs the 3-phase motor in the poker. As the poker vibrator is connected to a 1-phase wall socket-outlet it can be used everywhere. The comfortable start/stop knobs on the front side of the switch box are easily reached. The converter in the switch box has built-in functions that protect the equipment and the user against operational hazards. The strong and user-friendly switch box of impact resistant aluminum is designed to withstand the tough construction environment.
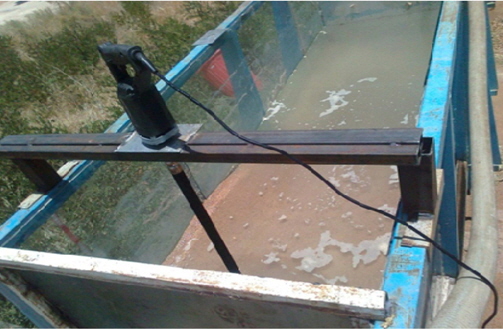
The real view, position of a vibration machine
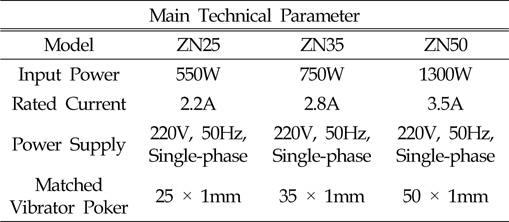
Product description of electronic vibrator
2.2 Dimensional Analysis
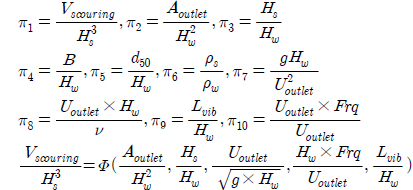
The volume of the flushing cone (Vscouring) may be written as a function of the following variables:
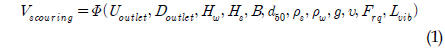
where, Uoutlet= velocity of flow at the entrance of the bottom outlet, Doutlet = the cross section of the bottom outlet, Hw = the height of the water above the center of the bottom outlet, Hs= the height of the sediment deposited above the center of the outlet, B= the width of the reservoir, d50= the median size of the sediment particles, ρs,= the density of the sediment, ρw,= water density, g= the acceleration due to gravity, υ = he kinematic viscosity, Frq= the frequency of the vibration, and Lvib= the position vibration. By using Buckingham’s theorem, and choosing the ρw, Hw, and Uoutlet as repeating variables, the following functional relationship describes the dimensionless flushing volume:
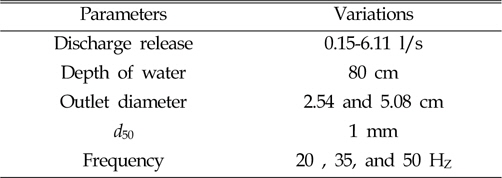
Range of variables in this research and parameter variations
Where 

2.3 Experiment Design
For running the experiments, the deposited sediment were flattened and leveled firstly to a specific level above the center of bottom outlet (15 cm), and the model was slowly filled with water until the water surface elevation reached to a desired level. Then, the bottom outlet was manually opened until the outflow discharge, become equal to the inflow discharge. Consequently, the sediment was released from main reservoir. At the beginning of the experiment when the downstream outlet opened, sediment was discharged with high concentration, but the concentration of sediment flushing decrease with time.
Experiments were continued until the flushing cone reached to an equilibrium (no further particle motion will be observe) condition in which the sediment concentration was negligible at the end of the experiment. The time required for the formation of the flushing cone depends on hydraulic conditions. The development of flushing cone was very fast, and the process finished in less than one minute to ten minutes in the experimental model. In this study, the time for running the experiment was set to 45 minute. At the end of each experiment, the flushing outlet was closed in which the incoming discharge was set to zero then water was carefully and slowly drained from the main reservoir. After the run of each experiment, the bed level of scouring was measured using digital point gauges, and the volume of flushing cone was calculated by Surfer 8.0 software.
3 RESULTS AND DISCUSION
As previously mentioned, a half-funnel scouring shape was created at the vicinity of the outlet gates in the pressure flushing operation. The maximum scour depth of this cone was found to be very close to the dam wall. The surface development of the scouring cone was the same in both the width and length, but the plan shape of the flushing cone over the deposited sediment was close to half the circumference. The longitudinal and side cone slopes were approximately equal, and were similar to the angle of sediment submerged repose. The results show that the position of the vibrator with respect to the dam axis and the vibration frequency were the main parameters affecting the flushing cone dimensions. In addition, with an increase in the vibration frequency, the dimensions of the flushing cone (volume, length, and width) increased.

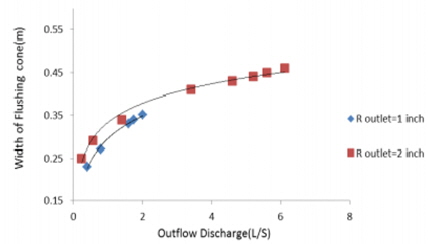
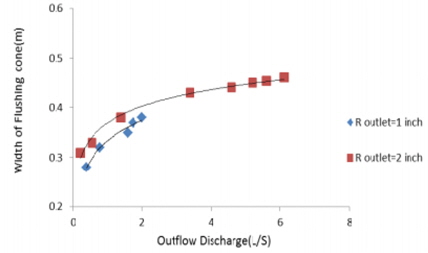
The variation of flushing cone width versus outflow discharge for fixed water depth(80cm) and the bottom outlet with 2.54 and 5.08 cm diameters.(Frq=0 HZ)
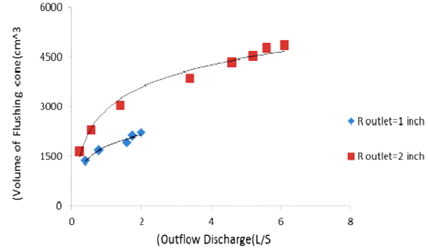
The variation of flushing cone volume versus outflow discharge for fixed water depth(80cm) and the bottom outlet with 2.54 and 5.08 cm diameters.(Frq=0 HZ)
The variation of flushing cone width versus outflow discharge for fixed water depth(80cm) and the bottom outlet with 2.54 and 5.08 cm diameters.(Frq=20 HZ)
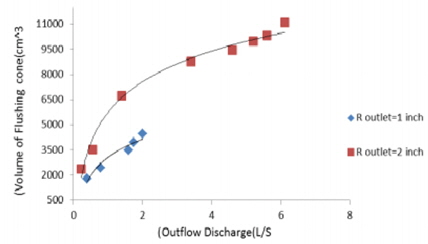
The variation of flushing cone volume versus outflow discharge for fixed water depth(80cm) and the bottom outlet with 2.54 and 5.08 cm diameters.(Frq=20 HZ)
The variation of flushing cone width versus outflow discharge for fixed water depth(80cm) and the bottom outlet with 2.54 and 5.08 cm diameters.(Frq=35 HZ)
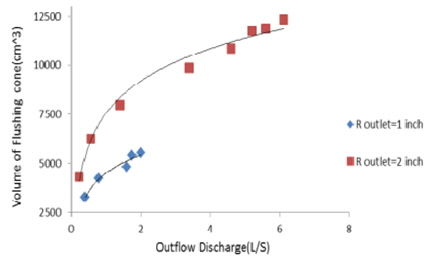
The variation of flushing cone volume versus outflow discharge for fixed water depth(80cm) and the bottom outlet with 2.54 and 5.08 cm diameters.(Frq=35 HZ)

The variation of flushing cone width versus outflow discharge for fixed water depth(80cm) and the bottom outlet with 2.54 and 5.08 cm diameters.(Frq=50 HZ)
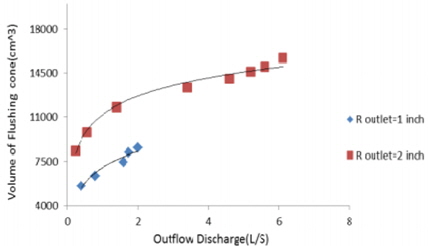
The variation of flushing cone volume versus outflow discharge for fixed water depth(80cm) and the bottom outlet with 2.54 and 5.08 cm diameters.(Frq=50 HZ)

The variation of flushing cone width versus outflow discharge, for fixed water depth(80cm) and the bottom outlet with 5.08 cm diameters (Frq= 0, 20, 35 and 50 HZ)

The variation of flushing cone volume versus outflow discharge, for fixed water depth(80cm) and the bottom outlet with 5.08 cm diameters (Frq= 0, 20, 35 and 50 HZ)
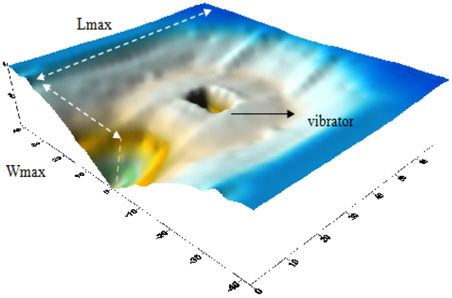
Vicinity of bottom outlet in frequency(50 HZ); 3dimensional, volume.( 15695 cm3, Q= 3 l/s, Hw=80cm, R=2 inch)
4. CONCLUSIONS
This study showed that AOutlet and vibration frequency are the main parameters in correlating the flushing cone dimensions. The results indicated that with increases in the diameter of the bottom outlet and vibration frequency, a new hydraulic condition is established for the flushing mechanism. This mechanism is common between all of the scouring dimensions. Thus, for a bigger bottom outlet and greater frequency, there is a greater diameter influence and a stronger orifice flow results. Consequently, sediment particles can be eroded at a greater distance from the outlet.
Acknowledgements
This work was supported by a 2-Year Research Grant of Pusan National University. I would like to express my very great appreciation to Prof Sang Kil Park and Dr. Asadollah Mardashti for their valuable and constructive suggestions during the planning and development of this research work.
References
Brown, C.B., 1943. The Control of Reservoir Silting. United States Department of Agriculture, Miscellaneous Publication No. 521, Washington, D.C., 166.
Brown C.B.. Miscellaneous Publication No. 521 United States Department of Agriculture. Washington, D.C.: 1943. p. 166.Chang, H.H., 1988. Fluvial Processes in River Engineering. John Wiley and Sons. New York.
Chang H.H.. Fluvial Processes in River Engineering John Wiley and Sons. New York: 1988.Emamgholizadeh, S., Bina, M., Fathimoghadam, M., Ghomeyshi, M., 2006. Investigation and Evaluation of the Pressure Flushing through Storage Reservoir. ARPN Journal of Engineering and Applied Sciences, 1(4).
Emamgholizadeh S., Bina M., Fathimoghadam M., Ghomeyshi M.. Investigation and Evaluation of the Pressure Flushing through Storage Reservoir. ARPN Journal of Engineering and Applied Sciences 2006;1(4)Graf, W.H., 1971. Hydraulics of Sediment Transport. McGraw-Hill, New York.
Graf W.H.. Hydraulics of Sediment Transport McGraw- Hill. New York: 1971.ICOLD, 1988. World Register of Dams, Update. International Commission on Large Dams, Paris.
World Register of Dams, Update International Commission on Large Dams. Paris: 1988.Julien, P.Y., 1995. Erosion and Sedimentation. Cambridge University Press. Cambridge, U.K.
Julien P.Y.. Erosion and Sedimentation Cambridge University Press. Cambridge, U.K.: 1995.Kadlec, R.H., Knight, R. L., 1995. Treatment Wetlands. Lewis Publishers, Boca Raton, Fla.
Kadlec R.H., Knight R. L.. Treatment Wetlands Lewis Publishers. Boca Raton, Fla: 1995.Meshkati Shahmirzadi, M.E., 2010. Experimental Investigation of Pressure Flushing Operation in Reservoir Storage. MSc thesis, Gorgan University of Agriculture Sciences and Natural R sources, Iran.
Meshkati Shahmirzadi M.E.. Experimental Investigation of Pressure Flushing Operation in Reservoir Storage. MSc thesis Gorgan University of Agriculture Sciences and Natural R sources; Iran: 2010.Mahmood, K., 1987. Reservoir Sedimentation: Impact, Extent, Mitigation. World Bank Technical Report 71, Washington, D.C.
Mahmood K.. World Bank Technical Report 71 Washington, D.C.: 1987.Scheuerlein, H., Tritthart, M., Nunez Gonzalez, F., 2004. Numerical and Physical Modeling Concerning the Removal of Sediment Deposits from Reservoirs. Conference proceeding of Hydraulic of Dams and River Structures, Tehran, Iran.
Scheuerlein H., Tritthart M., Nunez Gonzalez F.. Numerical and Physical Modeling Concerning the Removal of Sediment Deposits from Reservoirs In : Conference proceeding of Hydraulic of Dams and River Structures. Tehran, Iran; 2004.Shen, H.W., Lai, J.S., Zhao, D., 1993. Hydraulic Desiltation for Noncohesive Sediment. Proceeding of the 1993 Annual ASCE Hydraulic Engineering Conference, San Francisco, H.W Shen, S.T. Su, and F. Wen, eds, 119-124.
Shen H.W., Lai J.S., Zhao D., Shen H.W., Su S.T., Wen F.. Hydraulic Desiltation for Noncohesive Sediment In : Proceeding of the 1993 Annual ASCE Hydraulic Engineering Conference. San Francisco; 1993. p. 119–124.Shen, H.W., Lai, J.S., 1996. Sustain Reservoir useful Life by Flushing Sediment. International Journal of Sediment Research. 11(3), 10-17.
Shen H.W., Lai J.S.. Sustain Reservoir useful Life by Flushing Sediment. International Journal of Sediment Research 1996;11(3):10–17.Simons. D.B., Senturk. F., 1992. Sediment Transport Technology. Water Resources Publications, Littleton, Colo.
Simons D.B., Senturk F.. Sediment Transport Technology Water Resources Publications. Littleton, Colo: 1992.Vanoni, V.A., 1975. Sedimentation Engineering. ASCE, New York.
Vanoni V.A.. Sedimentation Engineering ASCE. New York: 1975.White, W.R., Bettess, R., 1984. The Feasibility of Flushing Sediments Through Reservoirs. Challenges in African Hydrology and Water Resources, Proceeding of Harare Symposium, July, D.E. Walling, S.S.D. Foster, P. Wurzel, eds, IAHS Publication.
White W.R., Bettess R., Walling D.E., Foster S.S.D., Wurzel P.. The Feasibility of Flushing Sediments Through Reservoirs In : Challenges in African Hydrology and Water Resources, Proceeding of Harare Symposium, July. IAHS Publication; 1984.Yang, C.T., 1996. Sediment Transport: Theory and Practice. McGraw-Hill, New York.
Yang C.T.. Sediment Transport: Theory and Practice McGraw-Hill. New York: 1996.