J. Ocean Eng. Technol. Search

CLOSE


J. Ocean Eng. Technol. > Volume 34(2); 2020 > Article
Son and Jeong: Numerical Study on the Improvement of the Motion Performance of a Light Buoy

Abstract

A light buoy is equipped with lighting functions and navigation signs. Its shape and colors indicate the route to vessels sailing nearby in the daytime, with its lights providing this information at night. It also plays a role in notifying the presence of obstacles such as reefs and shallows. When a light buoy operates in the ocean, the visibility and angle of light from the lantern installed on the buoy changes, which may cause them to function improperly. Therefore, it is necessary for the buoy to have stable and minimal motions under given environmental conditions, mainly waves. In this study, motion analyses for a newly developed lightweight light-buoy in waves were performed to predict the motion performance and determine the effect of the developed appendages for improving the motion performance. First, free decay tests, including benchmark cases, were performed using computational fluid dynamics (CFD) to estimate the viscous damping coefficients, which could not be obtained using potential-based simulations. A comparison was made of the results from potential-based simulations with and without considering viscous damping coefficients, which were estimated using CFD. It was confirmed that the pitch and heave motions of the buoy became smaller when the developed appendages were adopted.

1. Introduction

A light buoy is generally moored in a port, inland waterway, or coastal area to provide route information to ships sailing nearby based on its shape, color, and installed lanterns, and to provide information about hazards such as the presence of reefs or shallow water. Because conventional light buoys are made of iron materials, they are heavy, susceptible to corrosion and erosion, difficult to maintain, and have reported problems such as collisions with ships resulting in human injuries. To improve these problems, light buoys that adopt eco-friendly and lightweight materials have been developed (Jeong et al., 2017). The motions of floating offshore structures, as well as the light buoys, which are the subject of this study, are particularly affected by external environmental loads (esp., waves). To secure the motion and structural stability, the difference between the natural frequency of the structure and the frequency of the primary wave in the installation area should be increased or appendages should be developed and/or applied to improve the motion performance. In the case of light buoy, it is necessary to secure the performance of the pitch and roll motions because it is important to secure the visibility of the installed lantern even during these motions. In addition, if excessive heave occurs, it may cause structural damage to the mooring system. Son et al. (2018) estimated the wind and current loads acting on a light buoy subject to changes in the wind direction, wind speed, and current direction at various sea states using computational fluid dynamics (CFD) and analyzed the potential-based motion analysis of a single-moored light buoy by applying the estimated load. As a result of the analysis, it was predicted that the pitch and roll would show large values that did not satisfy the design target under certain sea status. One of the reasons was that viscous damping effect was not considered, which will be described later.
In general, experimental methods and numerical methods based on potential theory are widely used to estimate the motion performances of ships and floating bodies. Among these, it is difficult for potential-based motion analysis to accurately estimate motions that exhibit relatively strong viscous effects and non-linearities. In order to compensate for this problem, studies are in progress in which a viscous damping coefficient calculated through a free decay test or forced oscillation test is applied to a potential-based motion analysis. Bhattacharyya (1978), Journée and Massie (2001), and Kim et al. (2015) proposed methods to calculate the damping coefficient from free decay tests. Koh and Cho (2016) performed numerical analyses of the characteristics of the heave of a circular cylinder according to the number, size, and relative position of the damping plate using the viscous damping coefficient calculated by performing the free decay test. In a study related to the motion performance of a light buoy, Hong et al. (2001) conducted a model test to estimate the dynamic behavior of the light buoy and the tension force of mooring lines under an extreme environment. In addition to the experimental methods that have been conventionally performed, studies performing free decay tests using CFD have been actively conducted in recent years. Suk et al. (2016) performed a free decay test using CFD, and then estimated the motion performance of a platform supply vessel using Maxsurf Motion, which is commercial motion analysis software, along with the calculated damping coefficient. In addition, Ko et al. (2018a), Ko et al. (2018b), and Kim et al. (2019) performed free decay tests using experiments and CFD to estimate the motion responses of floating bodies in regular waves, and analyzed the motion characteristics.
The current study examined the effects of appendages developed to improve the pitch and heave performances of lightweight light buoys through numerical simulation. After performing the verification simulation for the free decay test using STAR-CCM+, the commercial CFD software made by Siemens, and confirming the accuracy of the used computational methods and schemes, free decay tests were performed on light buoys with/without appendages and the viscous damping coefficient was estimated from the results. In addition, the motion performance was analyzed by applying Aqwa, which is potential-based motion analysis software made by ANSYS Inc., to the estimated viscous damping coefficient, and the effect of the appendages was evaluated by comparing the pitch and heave response amplitude operators (RAOs) of the light buoy with and without appendages (Fig. 1).

2. Calculation of damping coefficient

The six degree of freedom motion equation for floating bodies in waves can be expressed by Eq. (1).
(1)
(Mij+aij)x¨j+Bijx˙j+Cijxj=Fji,j=1~6
where Mij is the mass or mass moment of inertia of the floating body, xj is the displacement of the j directional motion, aij is the i directional added mass or added mass moment of inertia due to the directional motion, Bij is the j directional damping coefficient due to the i directional motion, Cij is the j directional restoring coefficient due to the i directional motion, and Fj is the wave excitation force matrix.
When performing a free decay test to calculate the viscous damping coefficients of the heave and pitch, only a single degree of freedom motion is considered, as shown in Eqs. (2) and (3).
(2)
(M33+a33)x¨3+B33x˙3+C33x3=F3
(3)
(M55+a55)x¨5+B55x˙5+C55x5=F5
Eqs. (4)(6) were used to calculate the heave and pitch damping coefficients B33 and B55, respectively.
(4)
Bii=2ζii(Mii+aii)Ciii=3,5
(5)
C33=ρgA
(6)
C55=ρgGM
where ζ is a non-dimensional damping coefficient, ρ is the density, g is the acceleration of gravity, A is the waterplane area, ∇ is the displacement volume, and GM is the metacenter height.
Non-dimensional damping coefficient ζ is calculated using the method proposed by Journée and Massie (2001), and viscous damping coefficient bii,vis is calculated using Eq. (7), which was proposed by Koh and Cho (2016).
(7)
bii,vis=Biirii(ωo)i=3,5
where rii(ωo) is the radiation damping coefficient at the natural frequency.

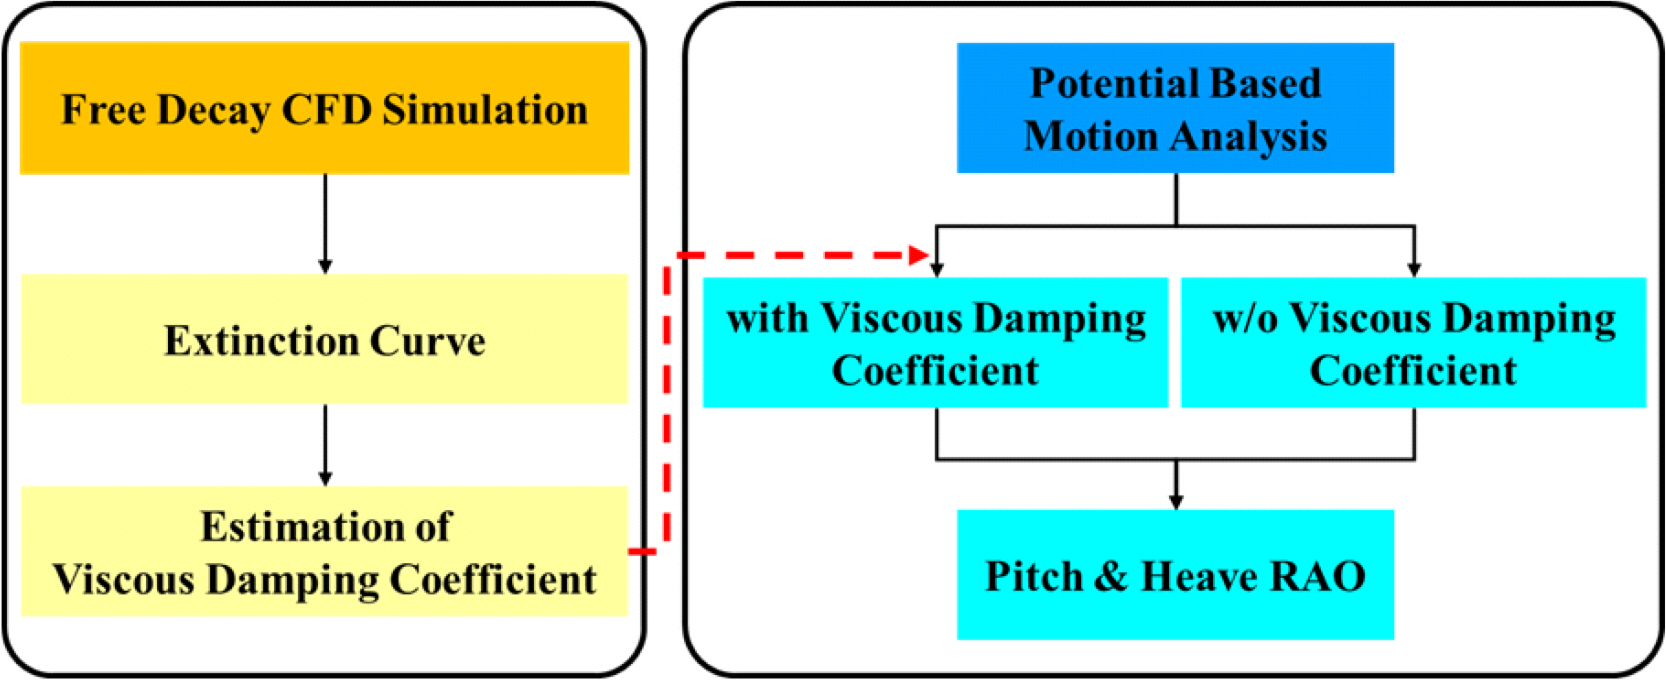
3. Estimation of viscous damping coefficient using CFD

3.1 Governing equation

The continuity equation and Reynolds-Averaged Navier-Stokes (RANS) equations were used as the governing equations for the unsteady and incompressible turbulent flows, which are shown in Eqs. (8) and (9), respectively.
(8)
uixi=0
(9)
uit+(uiuj)xj=1ρρxi+xi{(ν+νt)uixj}+fi
where u is the velocity vector, x is the coordinate, t is the time, p is the pressure, v is the kinematic viscosity, vt is the eddy viscosity, and f is the external force.

3.2 Numerical simulation method

STAR-CCM + 11.04 was used as the CFD analysis program, and the Realizable k-ε model was used as the turbulence model. The volume of fluid (VOF) method was used to capture the free-surface, and the overset grid and dynamic fluid body interaction (DFBI) techniques were applied to simulate the motion of the floating body.

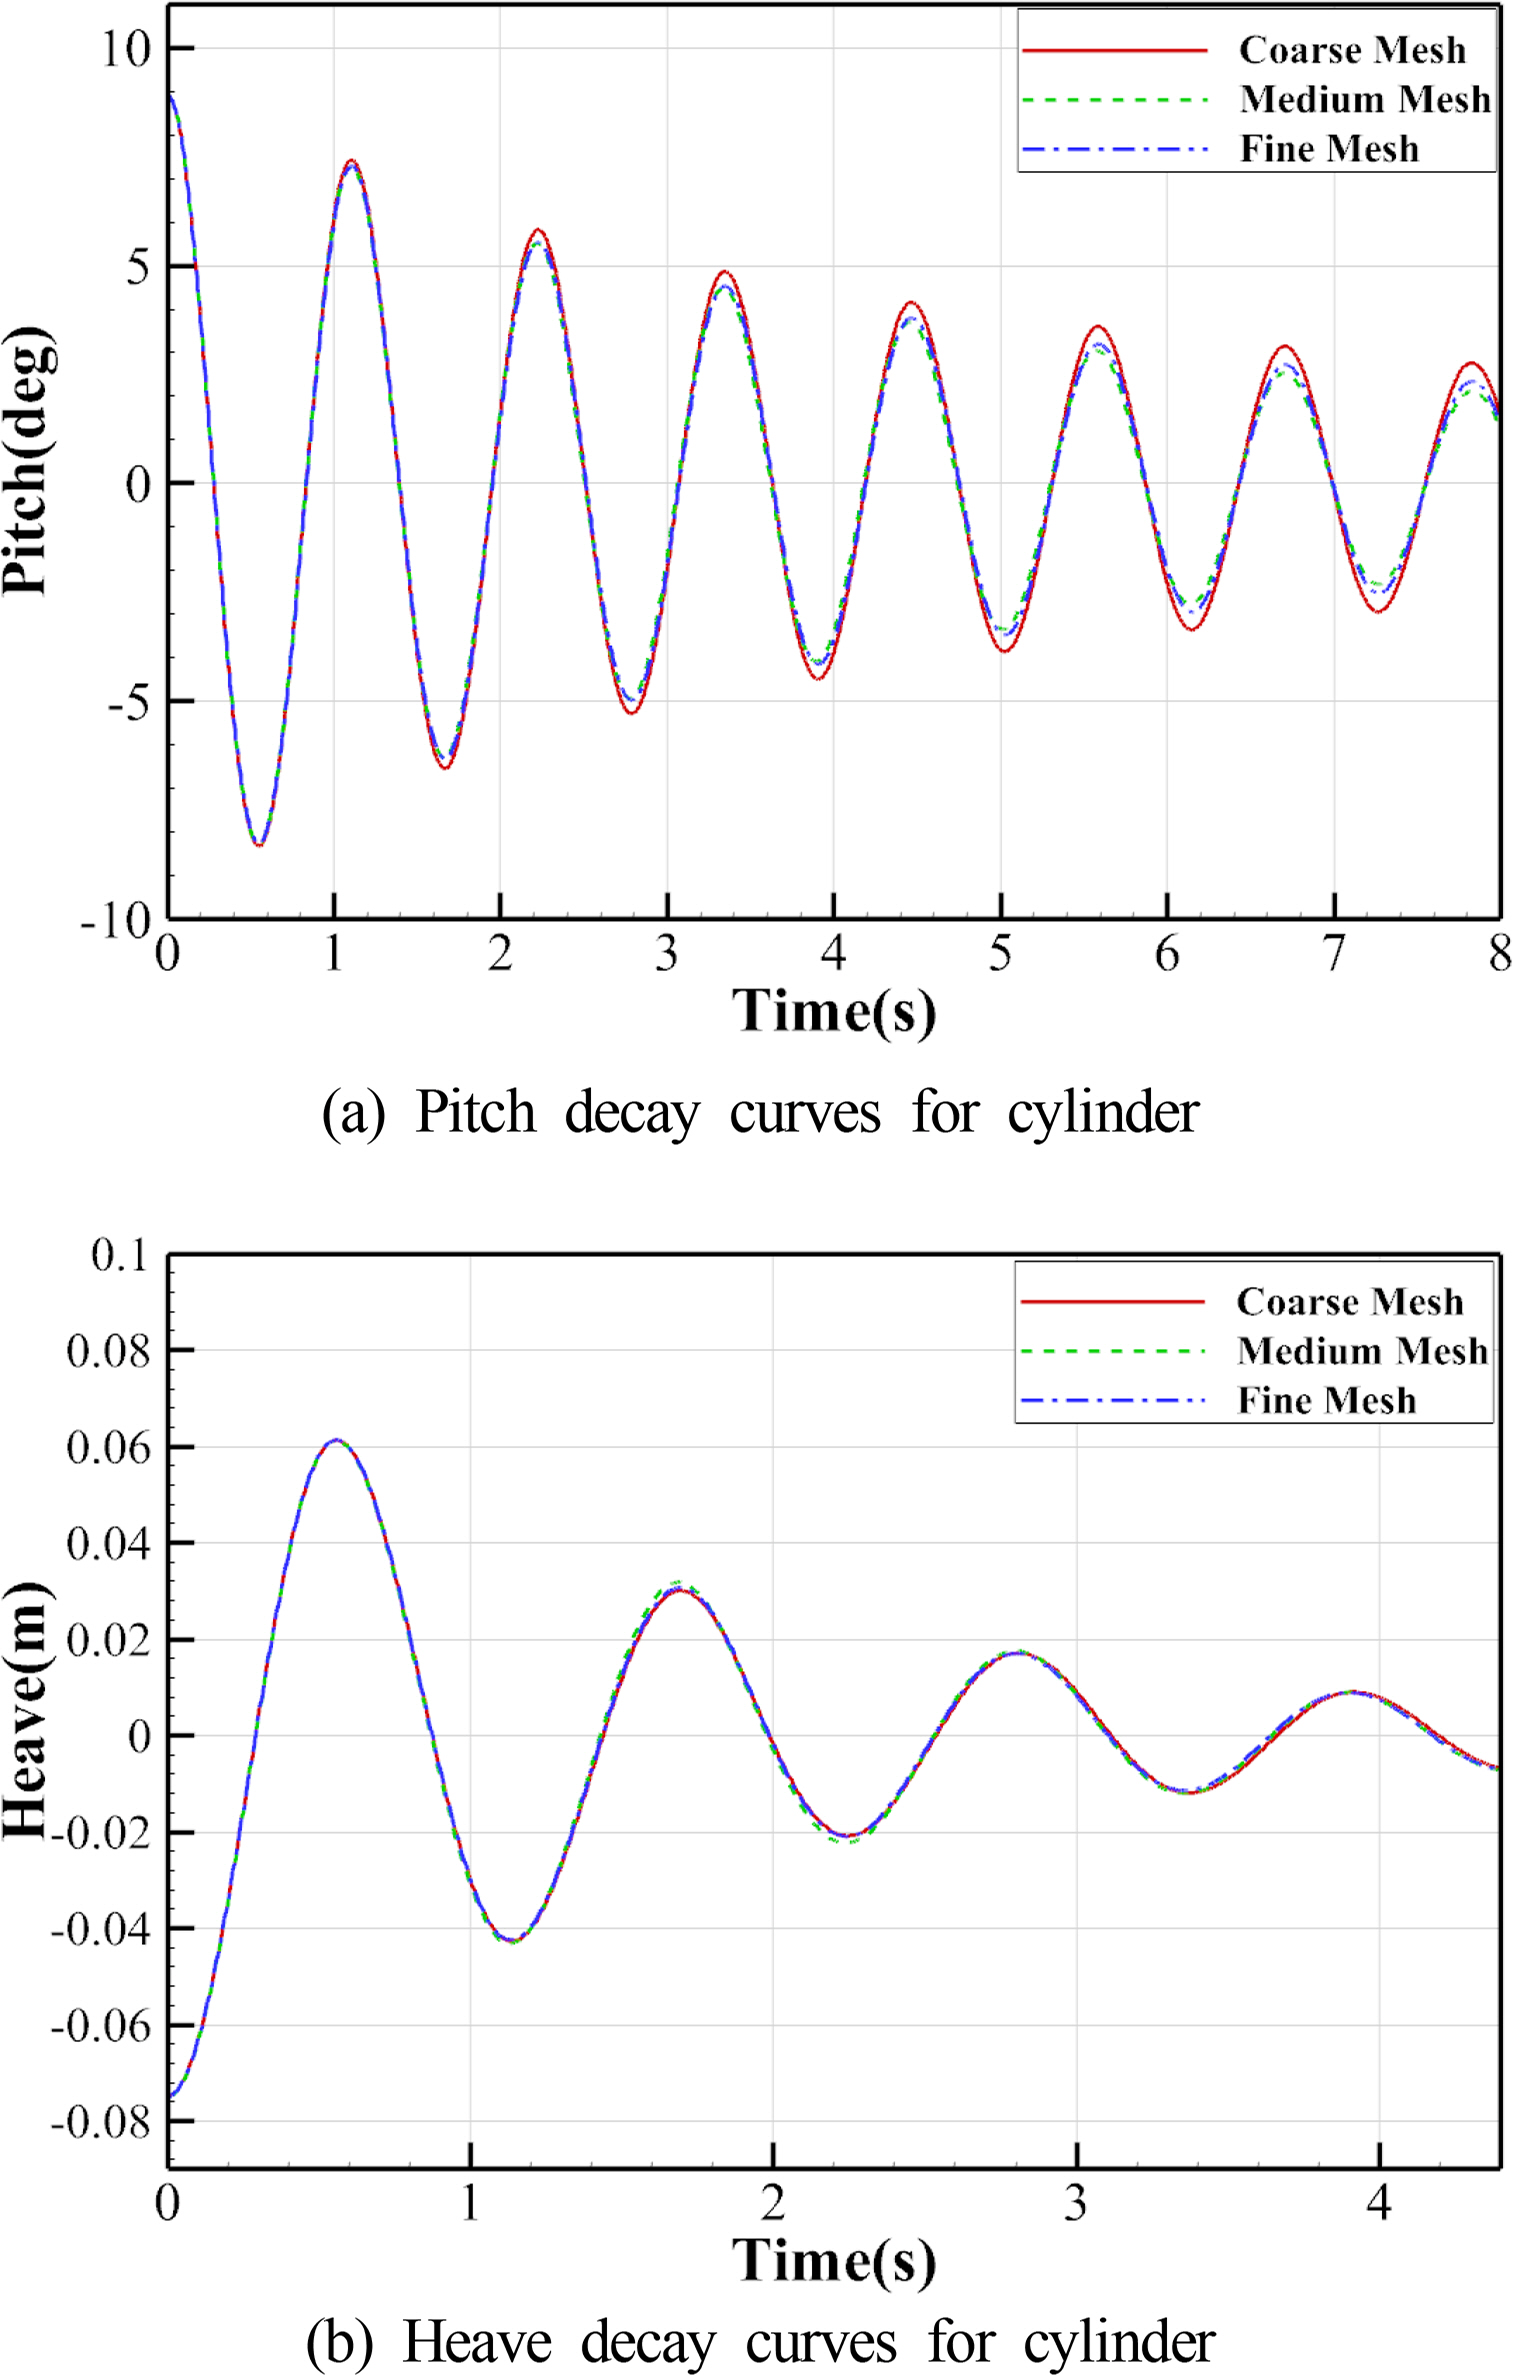
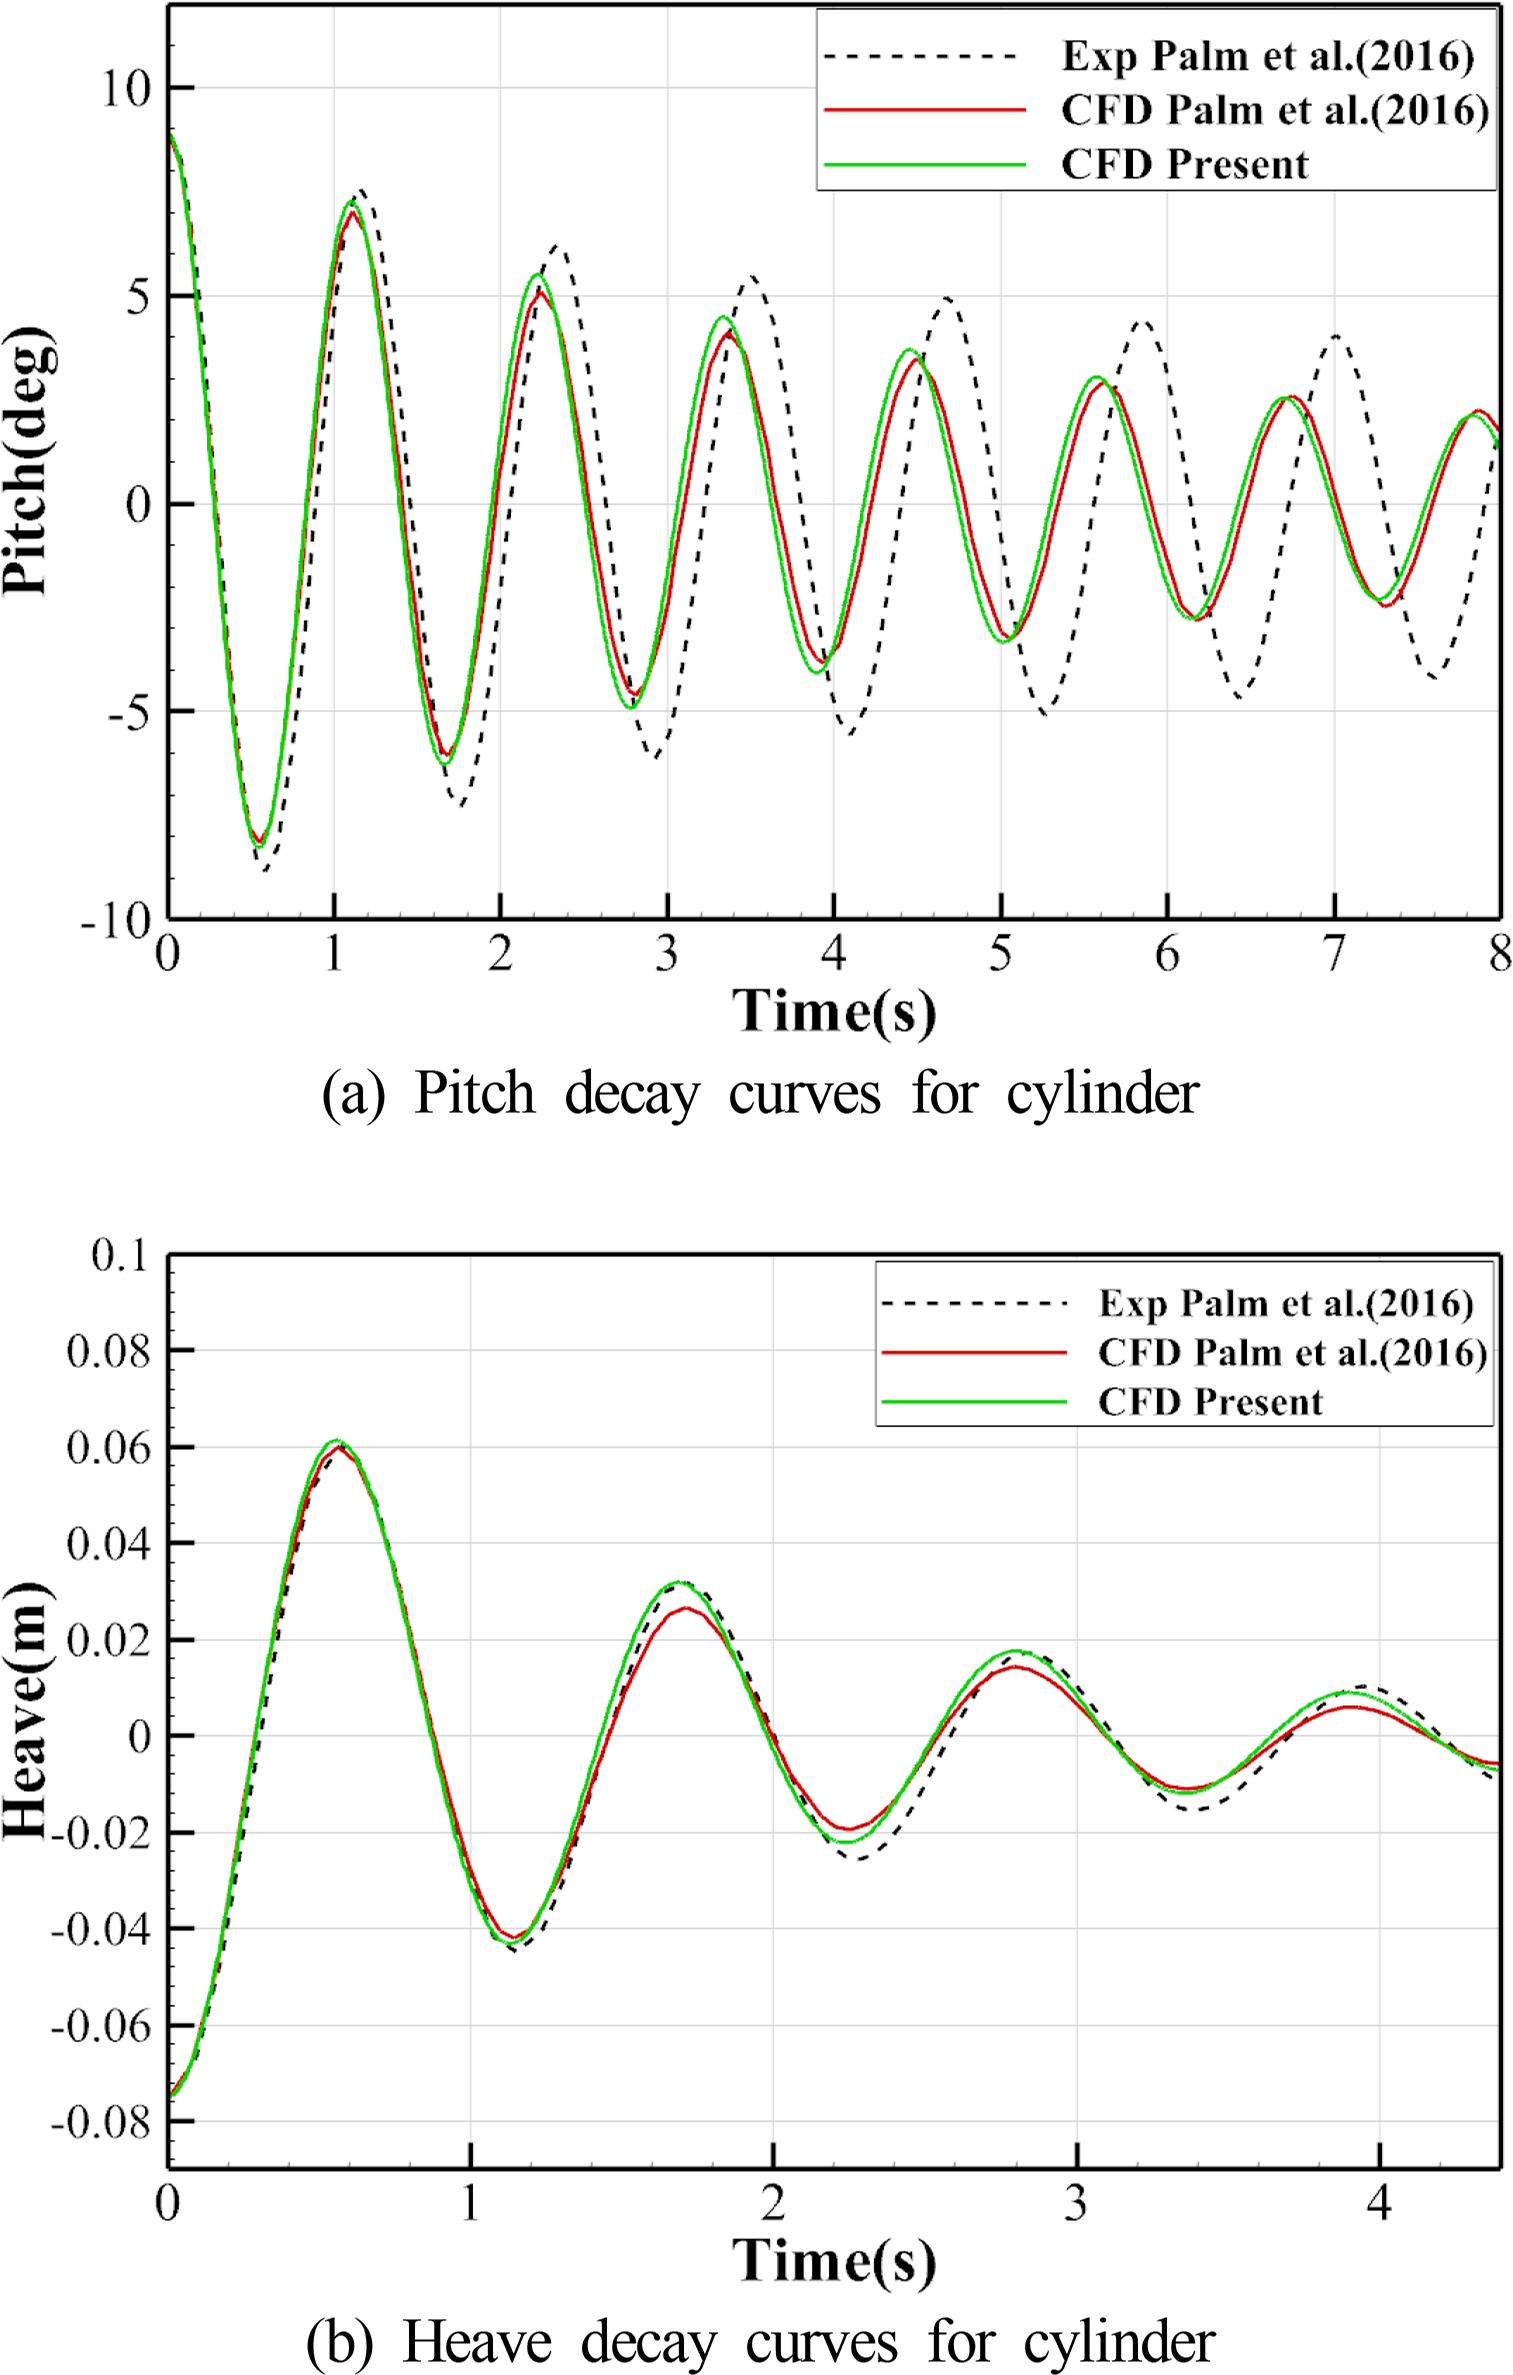
3.3 Verification simulation of free decay of circular cylinder

This simulation was performed under the same conditions as the free decay test and CFD simulation of the pitch and heave of a circular cylinder performed by Palm et al. (2016), and the results were compared. The diameter of the cylinder was 0.515 m, and the center of gravity in the vertical direction at the initial draft of 0.173 m was located 0.0758 m from the bottom of the cylinder. The horizontal axis moment was 0.9 kg·m2. The initial angle and displacement of the circular cylinder in the free decay test were 8.898° and 0.075 m, respectively.
First, a simulation to check the grid convergence was performed with three grid systems: a medium grid with the base size, coarse grid with a size 14% larger than the base size, and fine grid with a size 14% smaller than the base size. At this time, the numbers of grids were 711,139, 961,867, and 1,389,682 in the coarse, medium, and fine grid systems, respectively. As shown in Fig. 2, there was no significant difference in the results for the medium and fine grids.
Fig. 3 shows the time history of the pitch and heave of the circular cylinder obtained through the CFD simulation of this study compared to the experimental and CFD results obtained by Palm et al. (2016), and it can be seen that they are relatively coincident with each other. For a quantitative evaluation, natural frequency and non-dimension damping coefficients were calculated from the results of the free decay test and are shown in Table 1. The pitch natural frequency had significant differences of 2.68% and −1.40% compared to the results of the experiment and CFD analysis conducted by Palm et al. (2016), respectively. As described by Palm et al. (2016), these differences were caused by the significant influence on the pitch due to the center of gravity, moment of inertia, and draft, which are difficult to set and measure accurately in small-scale experiments.
The heave natural frequency respectively showed differences of 2.48% and 1.42% compared to the results of the experiment and CFD analysis conducted by Palm et al. (2016). It was considered to be a good match. To more accurately compare the attenuation of the pitch and heave, the damping coefficient was calculated and compared using the method proposed by Journée and Massie (2001). The pitch damping coefficient respectively showed differences of about 25.19% and −11.61% from the experiment conducted by Palm et al. (2016) and the CFD analysis. The heave damping coefficient respectively showed differences of about 5.8819% and −13.08% from the experiment conducted by Palm et al. (2016) and the CFD analysis. These values were closer to those of the experiment.

3.4 Free decay simulation of light buoy
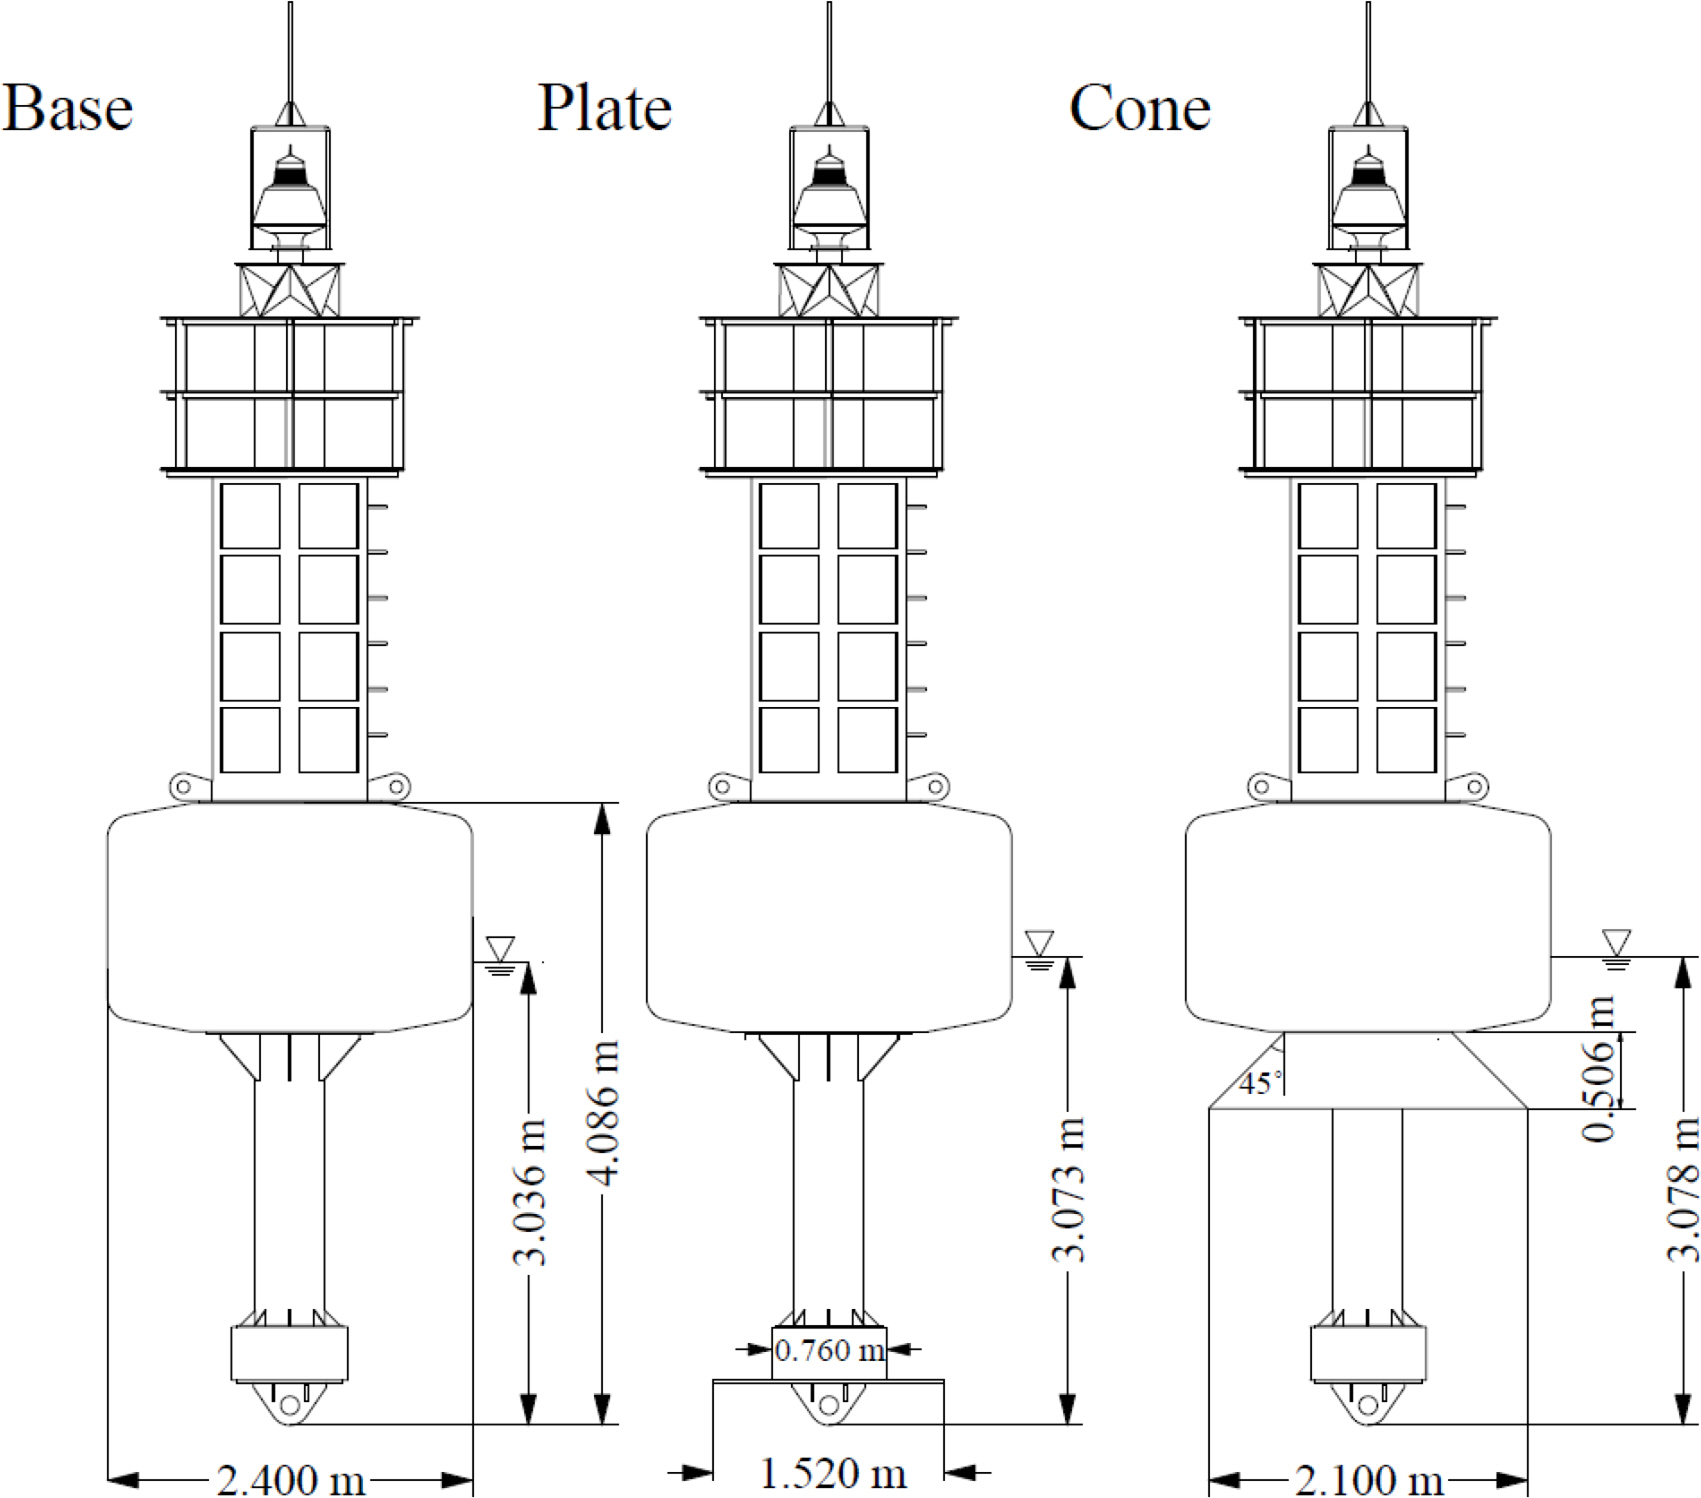
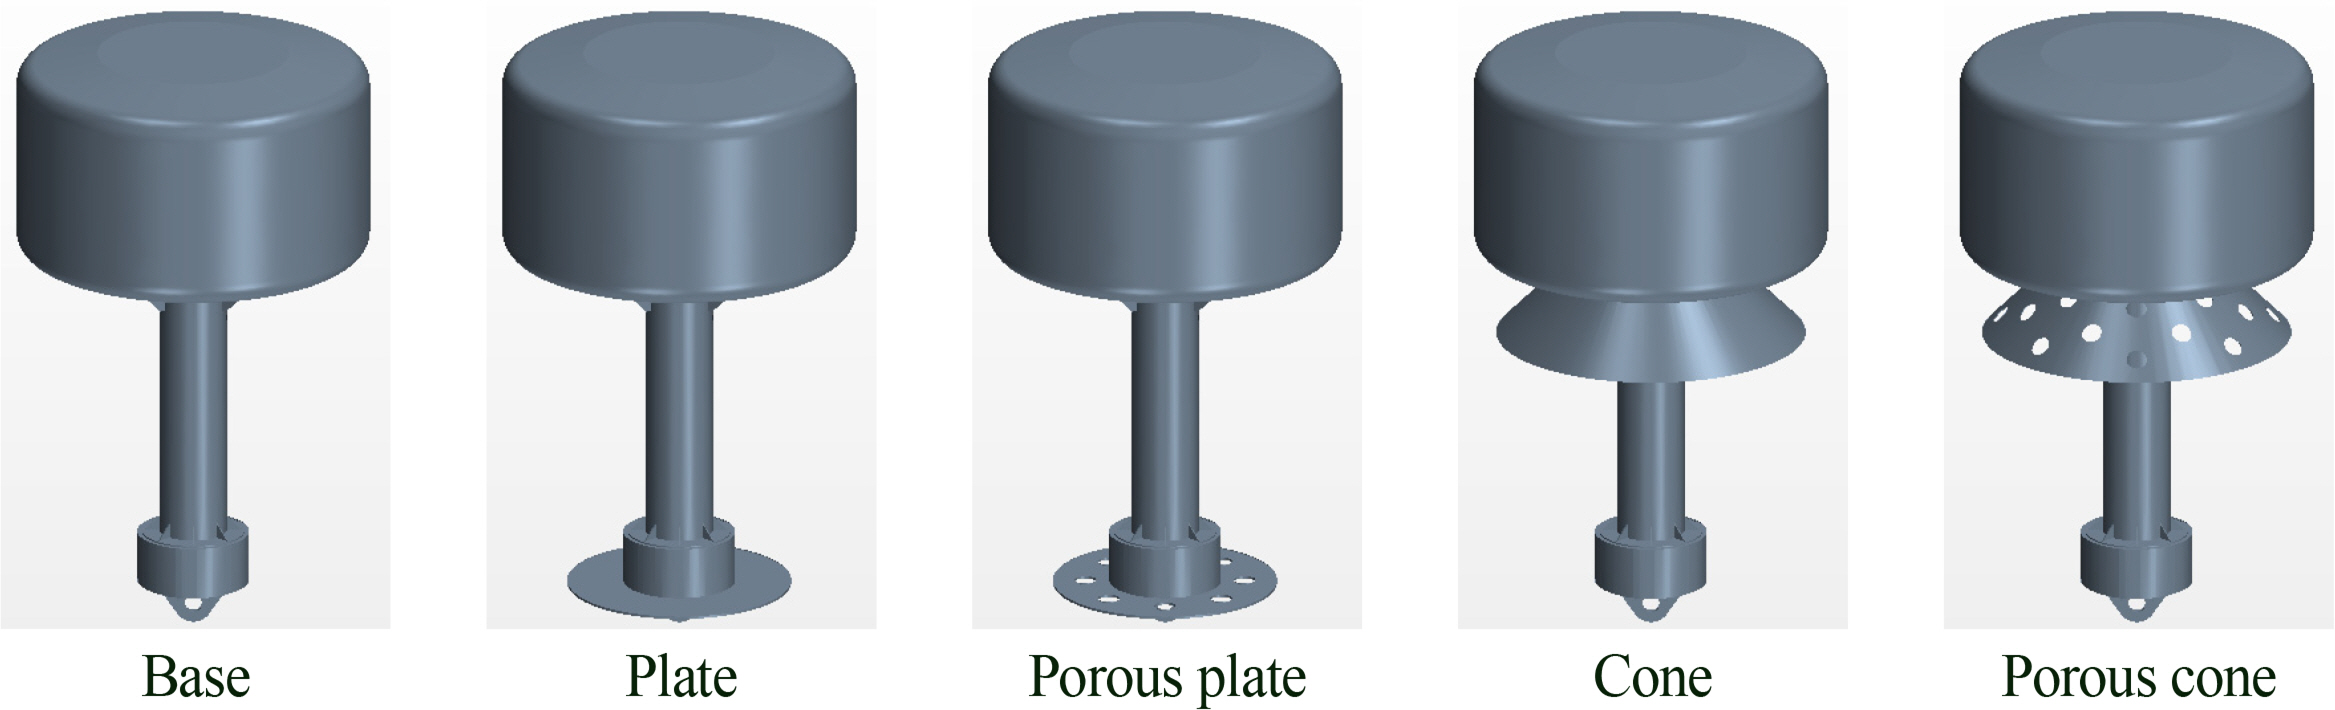
3.4.1 Target model

The recently developed LL-24 type of lightweight light buoy (Jeong et al., 2017) was targeted (Fig. 4). The height of the analysis model was 4.086 m, and the diameter of the buoyant body was 2.40 m. To improve the motion performance of the light buoy, two types of appendages were installed at the lower part of the light buoy. An appendage created based on the heave damping plate was installed on the lower center part of the buoy, and a conical structure created based on the bilge keel of the vessel was installed on the lower part of the buoyant body of the buoy (Fig. 5). Koh et al. (2013) conducted a study on the reduction of the circular cylinder’s heave according to the presence or absence of a damping plate with changing the porosity of the damping plate through a free decay test. The porous damping plate showed a higher damping coefficient than that of the non-porous damping plate. Therefore, the effect of porosity for each appendage was also investigated in this study. For the sake of convenience, the base model without an appendage was denoted as the base, and the models with a heave damping plate, porous heave damping plate, conical structure, and porous conical structure were respectively denoted as the plate, porous plate, cone, and porous cone. The main specifications of the light buoy and light buoy with a appendages installed are listed in Table 2. When the appendage was installed, the mass of the light buoy increased by about 7% compared to the base model, and the changes in the center of gravity and draft were considered in the numerical simulation.

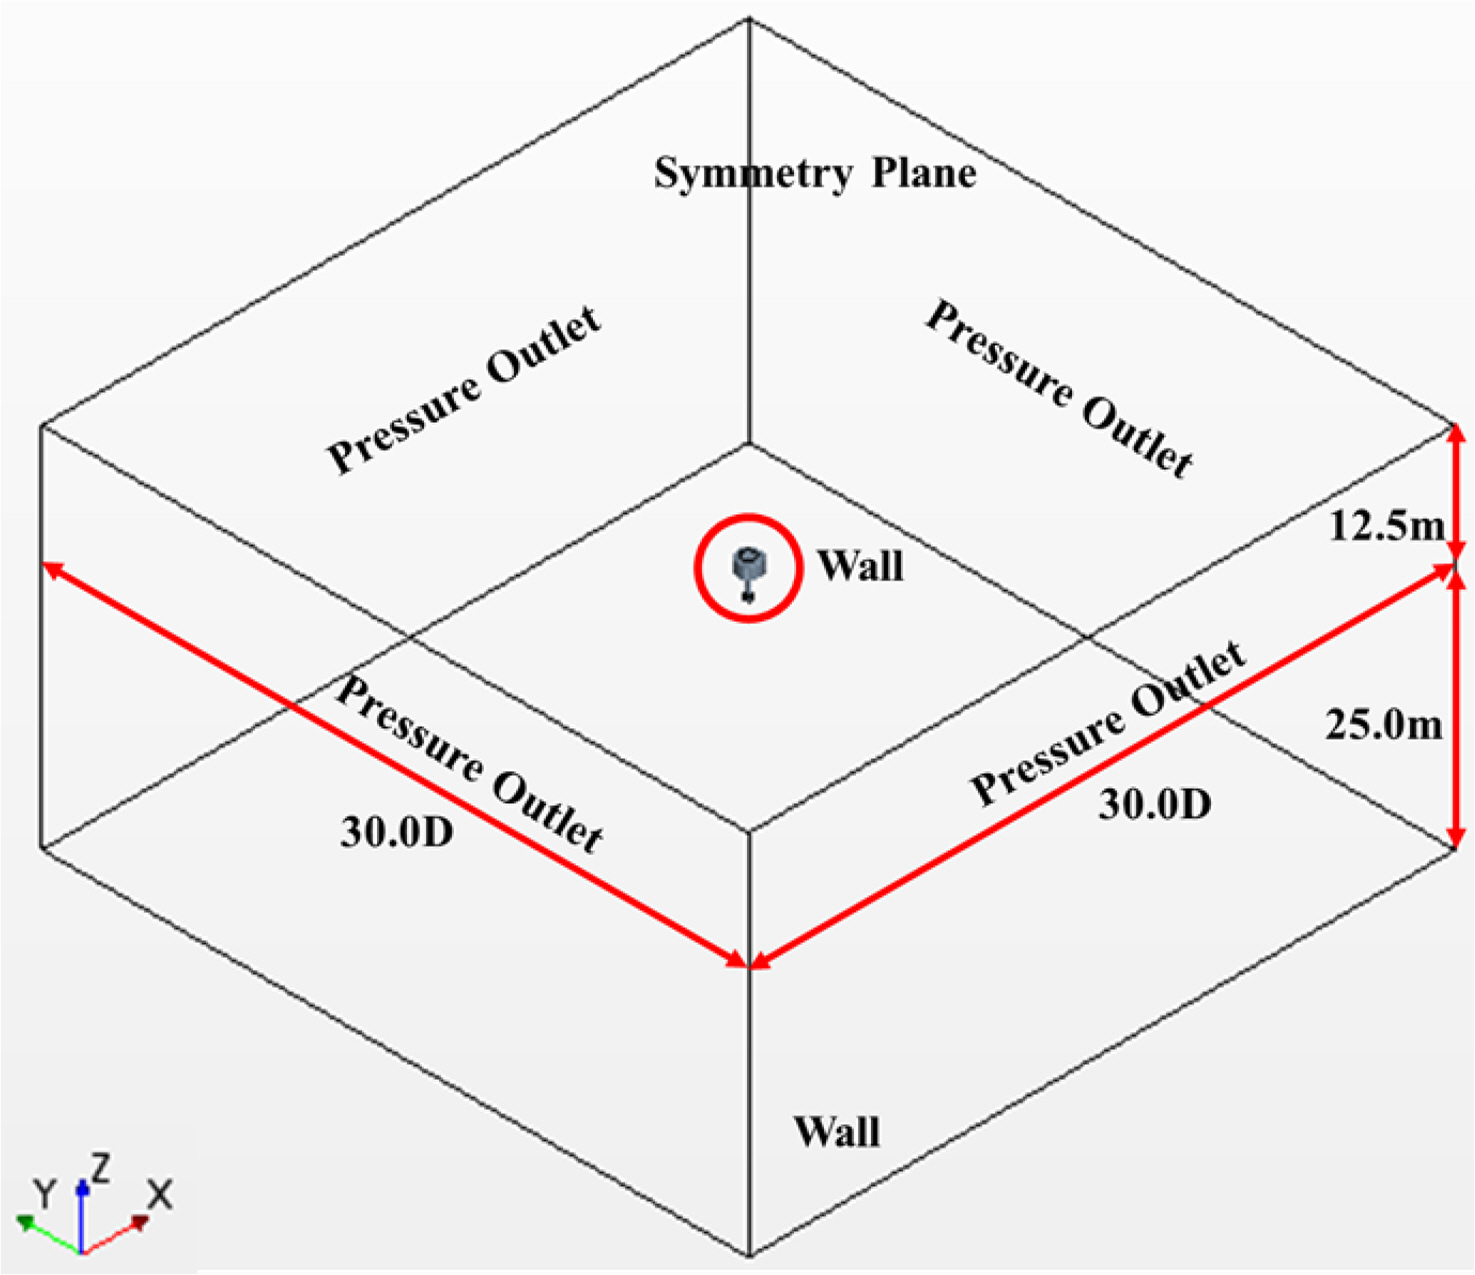
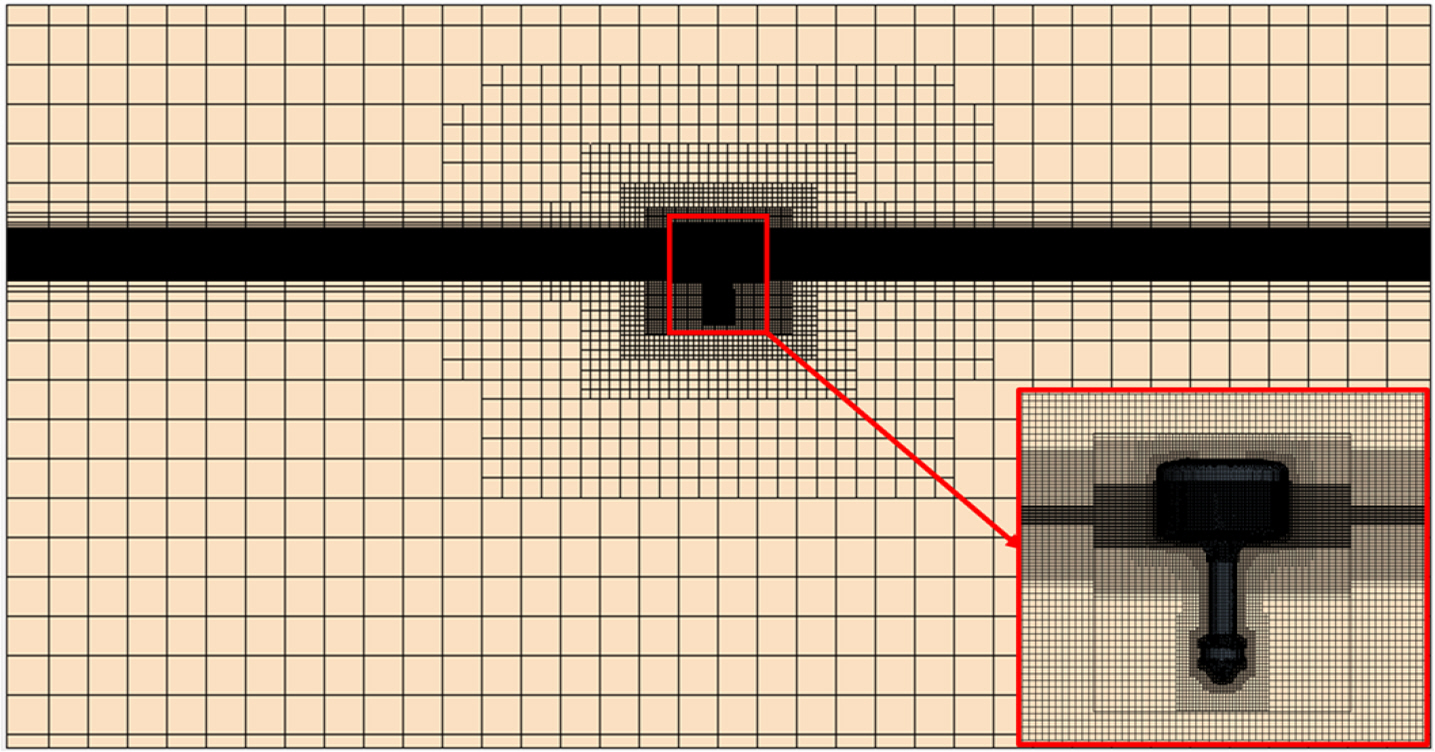
3.4.2 Computational domain, boundary conditions, and grid system

The computational domain and boundary conditions are illustrated in Fig. 6. The size of the computational domain was set to 25 m in the depth direction below the free water surface, and 30.0 D (=72.00 m) was set based on the diameter D (=2.40 m) of the buoyant body in the length and width directions. As the boundary conditions, a no-slip wall was applied to the bottom boundary surface, a symmetry plane condition was used for the upper surface of the computational domain, and a pressure outlet boundary condition was applied for other boundaries. In order to suppress the generation of reflected waves, the numerical damping of the wave was applied to a section corresponding to about 1/3 of the entire computational domain length from the end of the entire computational domain.
The grid systems were created using a surface remesher, trimmer mesh, and prism layer mesh. The grids were densely positioned to capture the complex flow around the light buoy and free surface (Fig. 7). On the basis of the pitch, 127 grids per wavelength and 51 grids per wave height were used. On the basis of the heave, 26 grids per wavelength and 10 grids per wave height were used. The total number of the grids was about 2.35 million in the base model, and about 2.9 million in most other cases depending on the type of appendage.
A degree of freedom was allowed the pitch, heave, and surge motions, and the initial angle and displacement of the light buoy were set to 10° for the pitch and 0.40 m below the draft in the vertical direction for the heave.

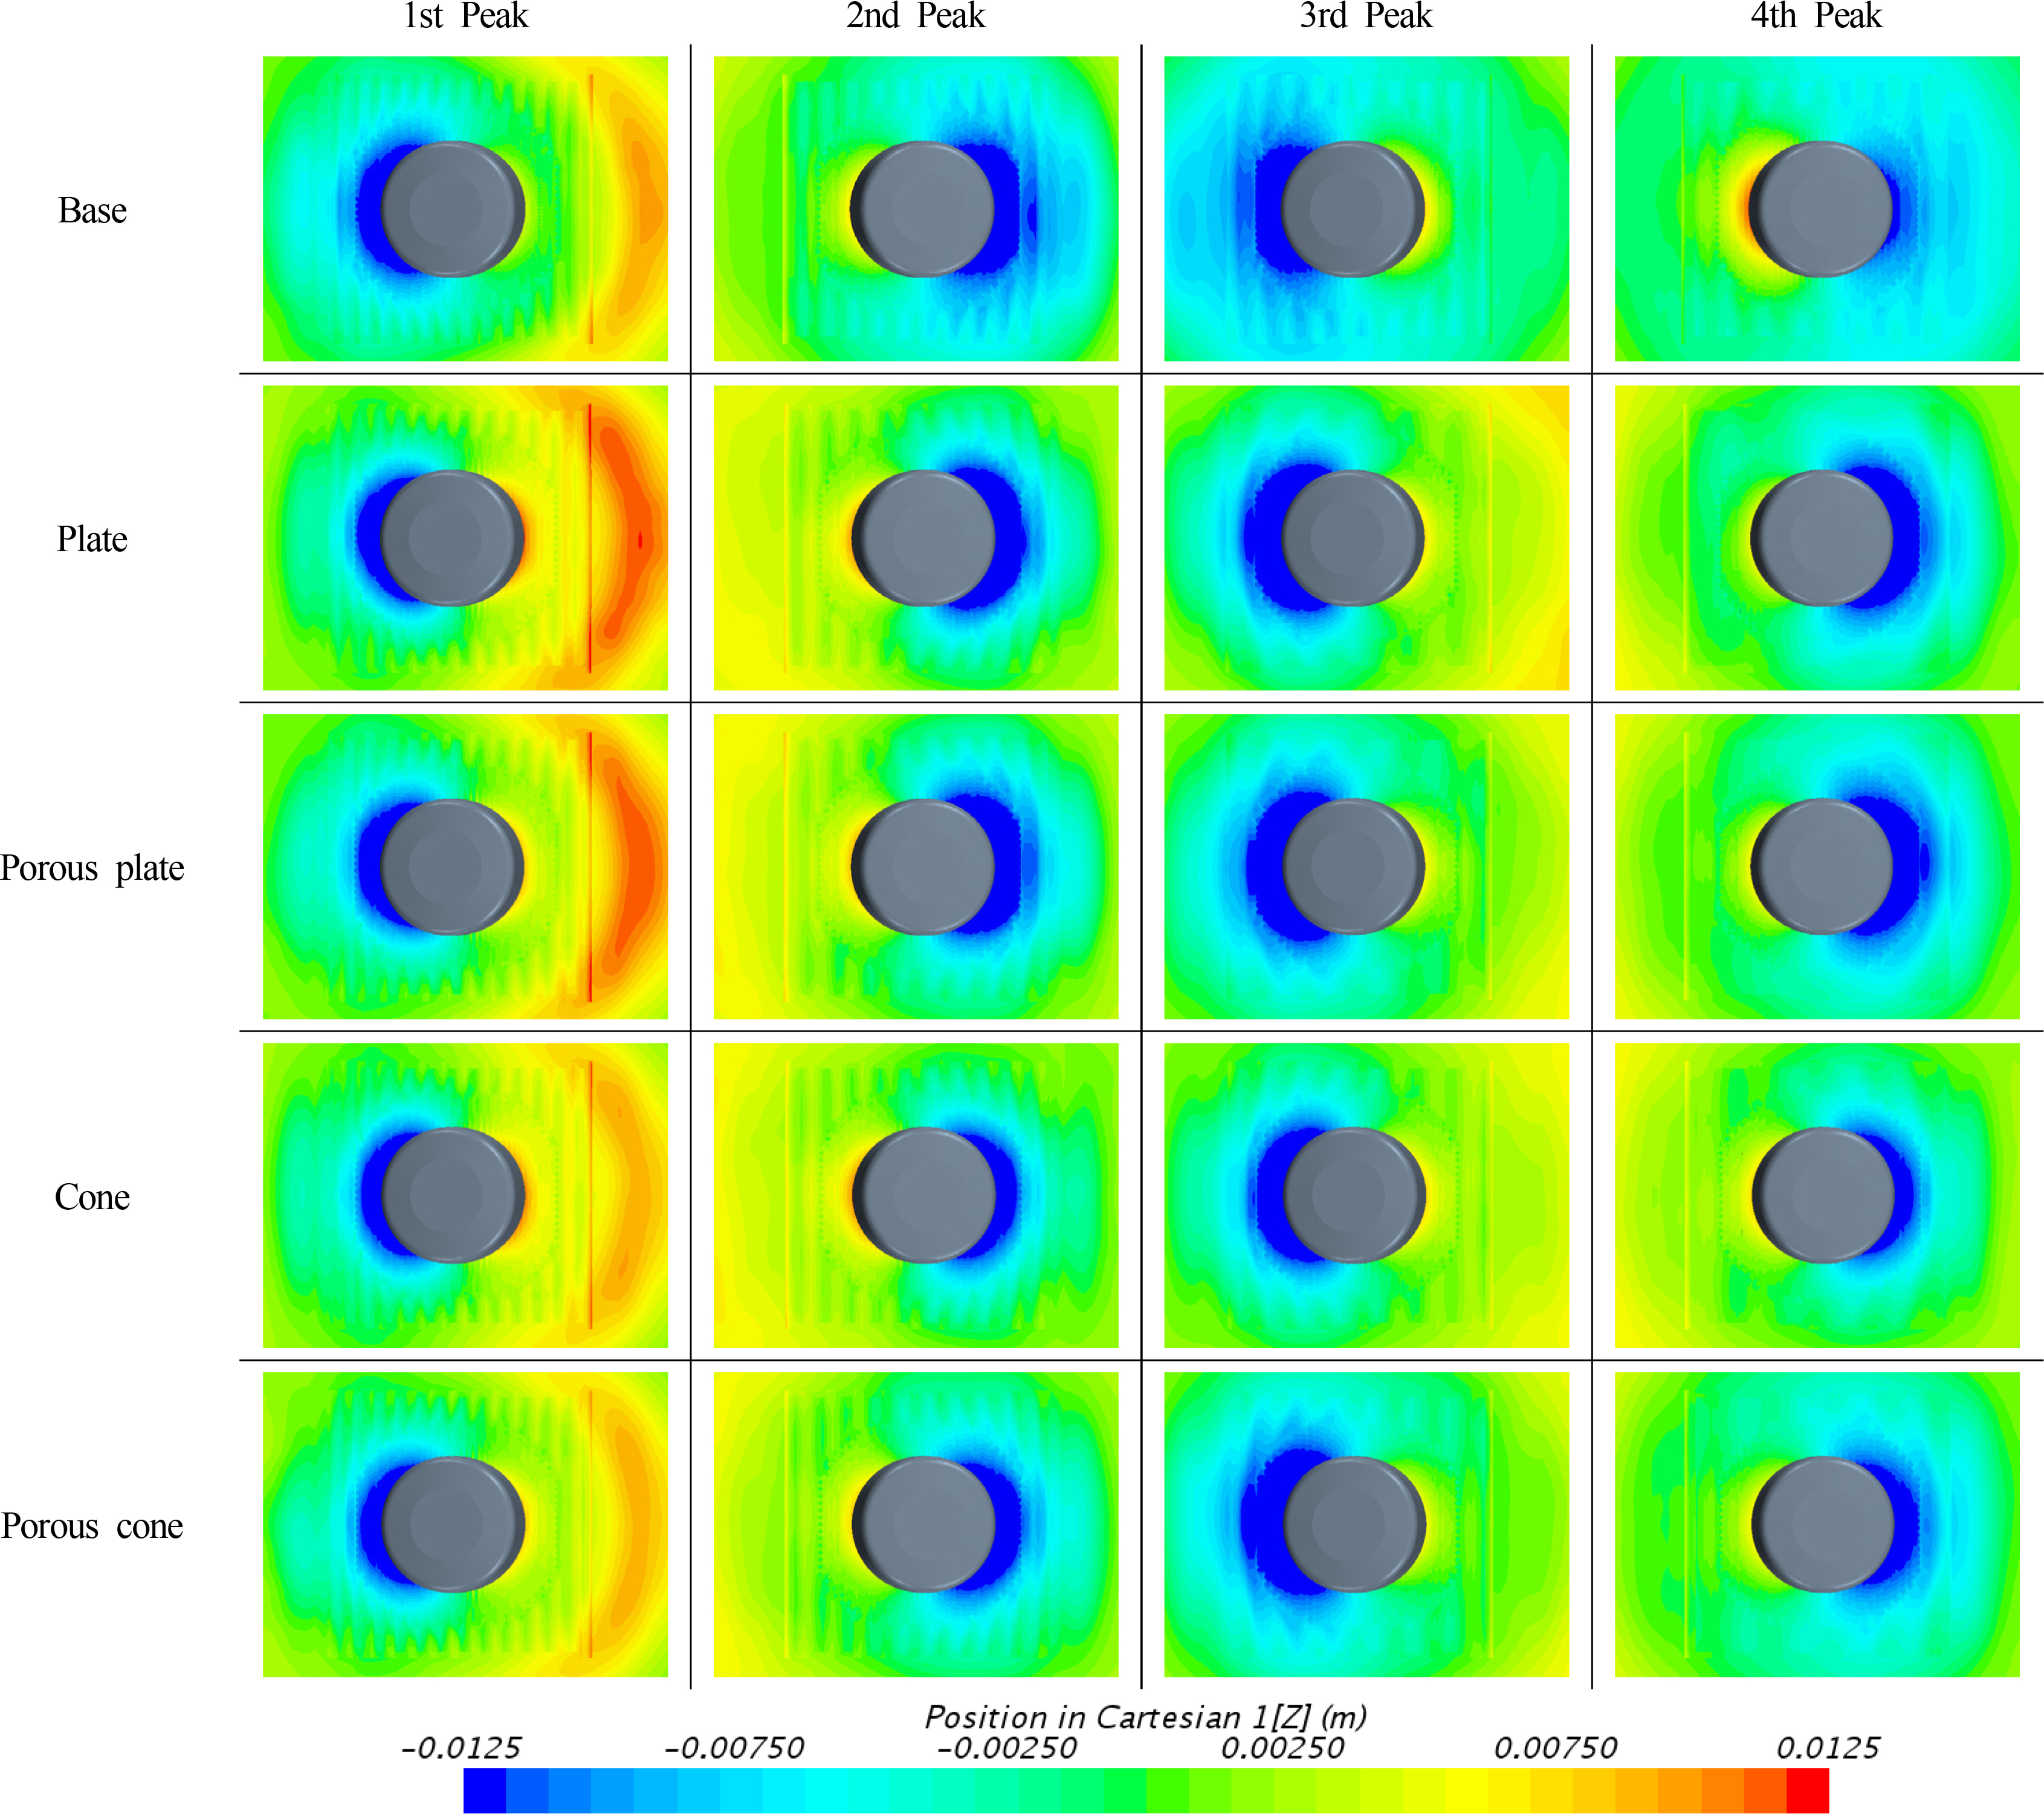
3.4.3 Result of numerical simulation

The pitch time history of the light buoys with and without appendages is illustrated in Fig. 8. The models with the appendage installed show faster damping than the base model and have smaller peaks when the plate and porous plate are installed compared to those when the cone and porous cone appendages are installed. The damping coefficients were estimated to compare the motion damping effects of the appendages in more detail and are listed in Table 3. It can be seen that the plate type appendages have the highest damping coefficients, and the damping coefficient increases in the same appendage with porosity. Depending on the porosity of the appendage, it was confirmed that the porous appendage had a relatively more significant damping effect than the non-porous appendage, as presented in the research of Koh et al. (2013). In addition, the pitch natural frequency was estimated to be higher than that of the base model when an appendage was installed. The natural frequency increased when the appendage was installed. This was because the GM and draft increased and the restoring moment coefficient also increased as a result of the installation of the appendage.
Fig. 9 shows the vorticity distribution at each peak position (phase) when the light buoy proceeds with pitch free decay. It can be seen that a complex and strong vortex is formed around the appendage. Therefore, the viscous damping coefficient increases due to the energy loss caused by the vortex generation, strong viscous effect, and interaction with the light buoy.
Fig. 10 shows the wave elevation around the light buoy at each peak position (phase) when the light buoy proceeds with pitch free decay. Looking at the first peak, it can be seen that a relatively high wave is generated around the model when an appendage is installed. It seems that the increase in the amount of energy dissipation due to wave generation results in an increase in the damping coefficient.
The heave time history of the light buoys with and without appendages is illustrated in Fig. 11. As with the said pitch, the models with the appendage installed show faster damping than the base model and have smaller peaks when the plate and porous plate are installed than when the cone and porous cone appendages are installed. The damping coefficients were estimated to compare the motion damping effects of the appendages in more detail and are listed in Table 4. It was estimated that the plate-type appendages had the highest damping coefficients, and the damping coefficient increased for the same appendage with porosity. When the appendage was installed, the natural frequency was estimated to be smaller than that of the base model. The natural frequency varied depending on the model. It was thought that this was because the mass and/or added mass was changed by the installation of the appendage, and the damping coefficient increased as a result of radiation and viscosity.
Fig. 12 shows the vorticity distribution at each peak position (phase) when the light buoy proceeds with heave free decay. As with the pitch, a complex and strong vortex is formed around appendages in heave, and, in particular, it is clearly created in the plate modes.
Fig. 13 shows the wave elevation around the light buoy at each peak position (phase) in heave free decay. When looking at the first and second peaks, the models with appendages installed produce lower waves than the base model. This is because the heave becomes smaller as a result of the installation of the appendage.

4. Estimation of motion performance

The potential-based motion analysis was performed using ANSYS Aqwa with applying the viscous damping coefficient, which was estimated through the CFD simulations of the free decay tests and dealt as a linear damping.

4.1 Estimated result of motion performance

Table 5 lists the added mass moment of inertia, radiation damping coefficient, viscous damping coefficient, and ratio of the viscous damping to the entire damping coefficient in the pitch motion at natural frequencies calculated through the potential-based motion analysis. The installation of appendages caused increases in the mass moment of inertia and viscous damping coefficient. In addition, the radiation damping coefficient accounted for a very small portion of the entire damping coefficient, whereas the viscous damping coefficient accounted for a significant portion. The estimated viscous coefficients are placed in descending order of the porous plate, plate, porous cone, cone and base.
Fig. 14(a) and Fig. 14(b) respectively show the pitch RAOs when the viscous damping coefficient is not considered and when it is considered. When the viscosity was not considered, it was confirmed that a very large motion occurred regardless of whether or not an appendage was installed near the natural frequency (1.397 rad/s) of the base model. This was because the viscous damping. which accounted for a significant portion of the damping coefficient of the pitch motion, was ignored. Considering the viscous damping coefficient, it was shown that the RAO was significantly reduced in Fig 14(b). The maximum values of the pitch RAO were placed in the ascending order of the porous plate, plate, porous cone, cone, and base.
Table 6 lists the added mass, radiation damping coefficient, viscous damping coefficient, and ratio of viscous damping to the entire damping coefficient for the pitch motion at natural frequencies calculated through the potential-based motion analysis. With the exception of the cone model, the models had radiation damping coefficients that were larger than the viscous damping coefficient. The ratio of the viscous damping coefficient to the entire damping coefficient was smaller than the pitch motion. This was because the wave elevation caused by the heave of a circular cylinder type floating body was higher than that caused by the pitch motion. In addition, the ratio of the radiation damping coefficient to the entire damping coefficient decreased when the appendages were installed because the maximum motion displacement and velocity were reduced as a result of the installation of appendages. The estimated viscous damping coefficients were placed in the descending order of the cone, porous cone, porous plate, plate, and base.
Fig. 15(a) and Fig. 15(b) respectively show the heave RAOs estimated through the analysis of the potential-based motion when the viscous damping coefficient is not considered and when it is considered. The difference in the RAO values when the viscous damping coefficient is considered and when it is not considered at the natural frequency (3.107 rad/s) of the base model is smaller than that in the pitch motion because the ratio of the viscous damping coefficient to the heave damping coefficient is relatively small. When the viscosity was not considered, the base model was estimated to have the greatest reduction in motion in the vicinity of the natural frequency, but when the viscosity was considered, the motion of the light buoy with appendage decreased. The maximum values of the heave RAO were placed in the ascending order of the porous cone, porus plate, cone, plate, and base. As with the pitch motion, the maximum value of the heave RAO was estimated to be reduced in all the models with appendages installed.

5. Conclusion

This study examined the effect of reducing the pitch and heave motions of the appendages developed to improve the motion of a light buoy through numerical analyses. In addition, the motion performance of the light buoy was examined in relation to the installation and type of appendage by performing analyses of the potential-based motion while applying the viscous damping coefficient estimated through a free decay test using CFD.
  1. For validation, a CFD simulation of the circular cylinder’s pitch and heave free decay was performed. The results were compared to the experimental results and other CFD results and were in good agreement with them.

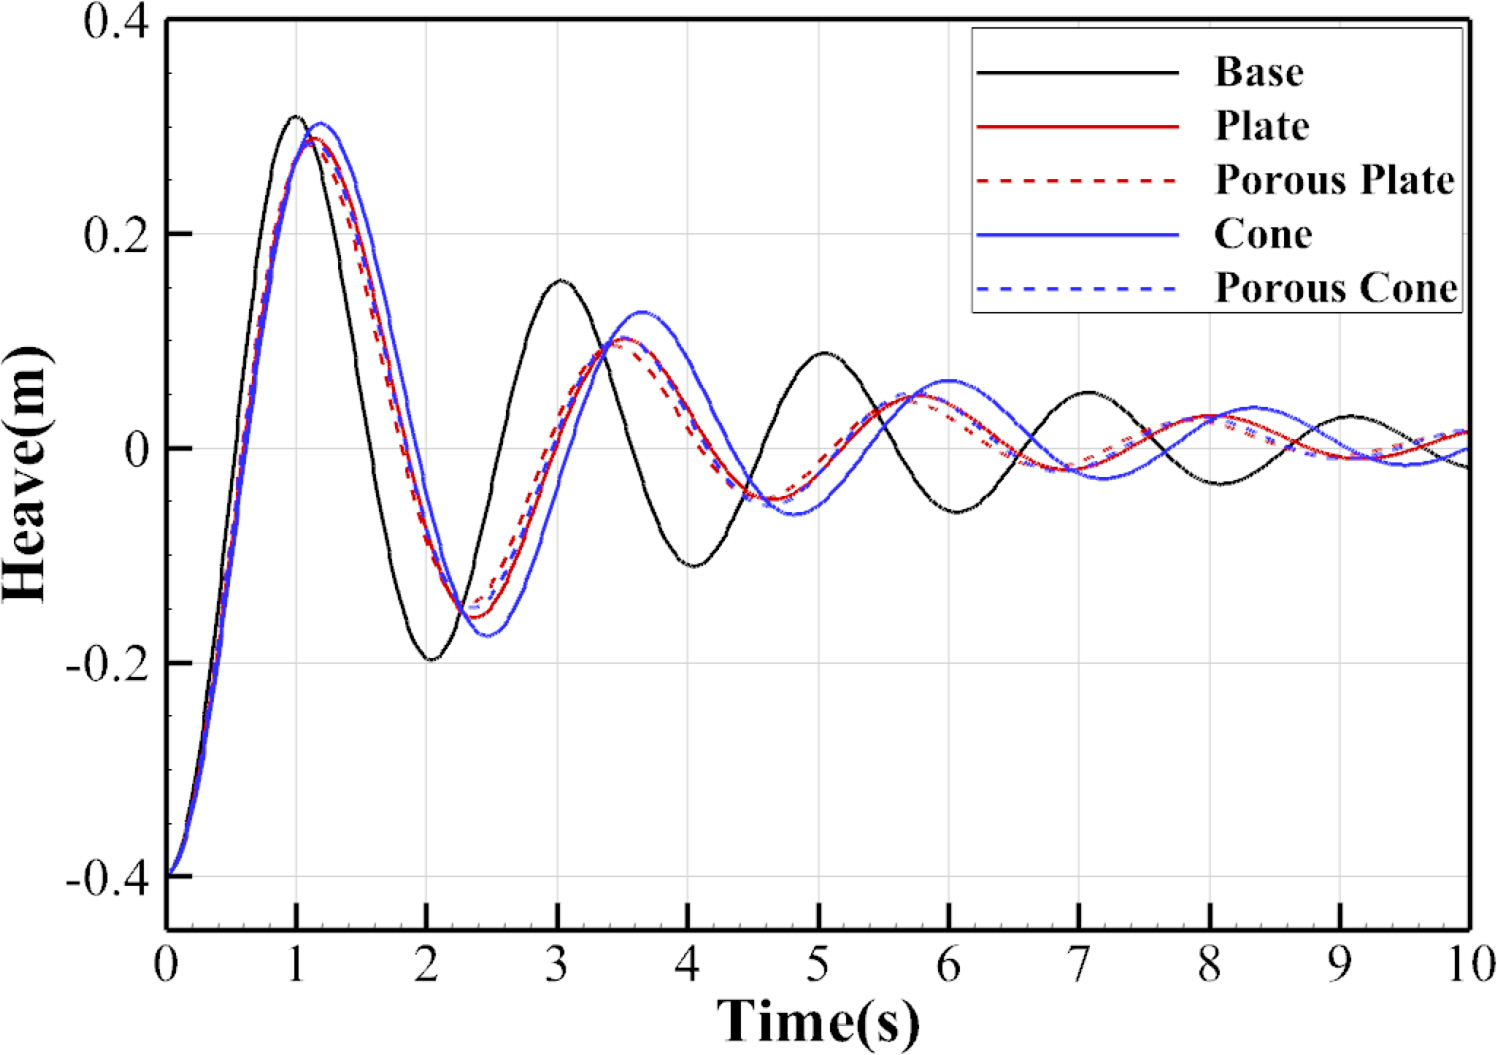
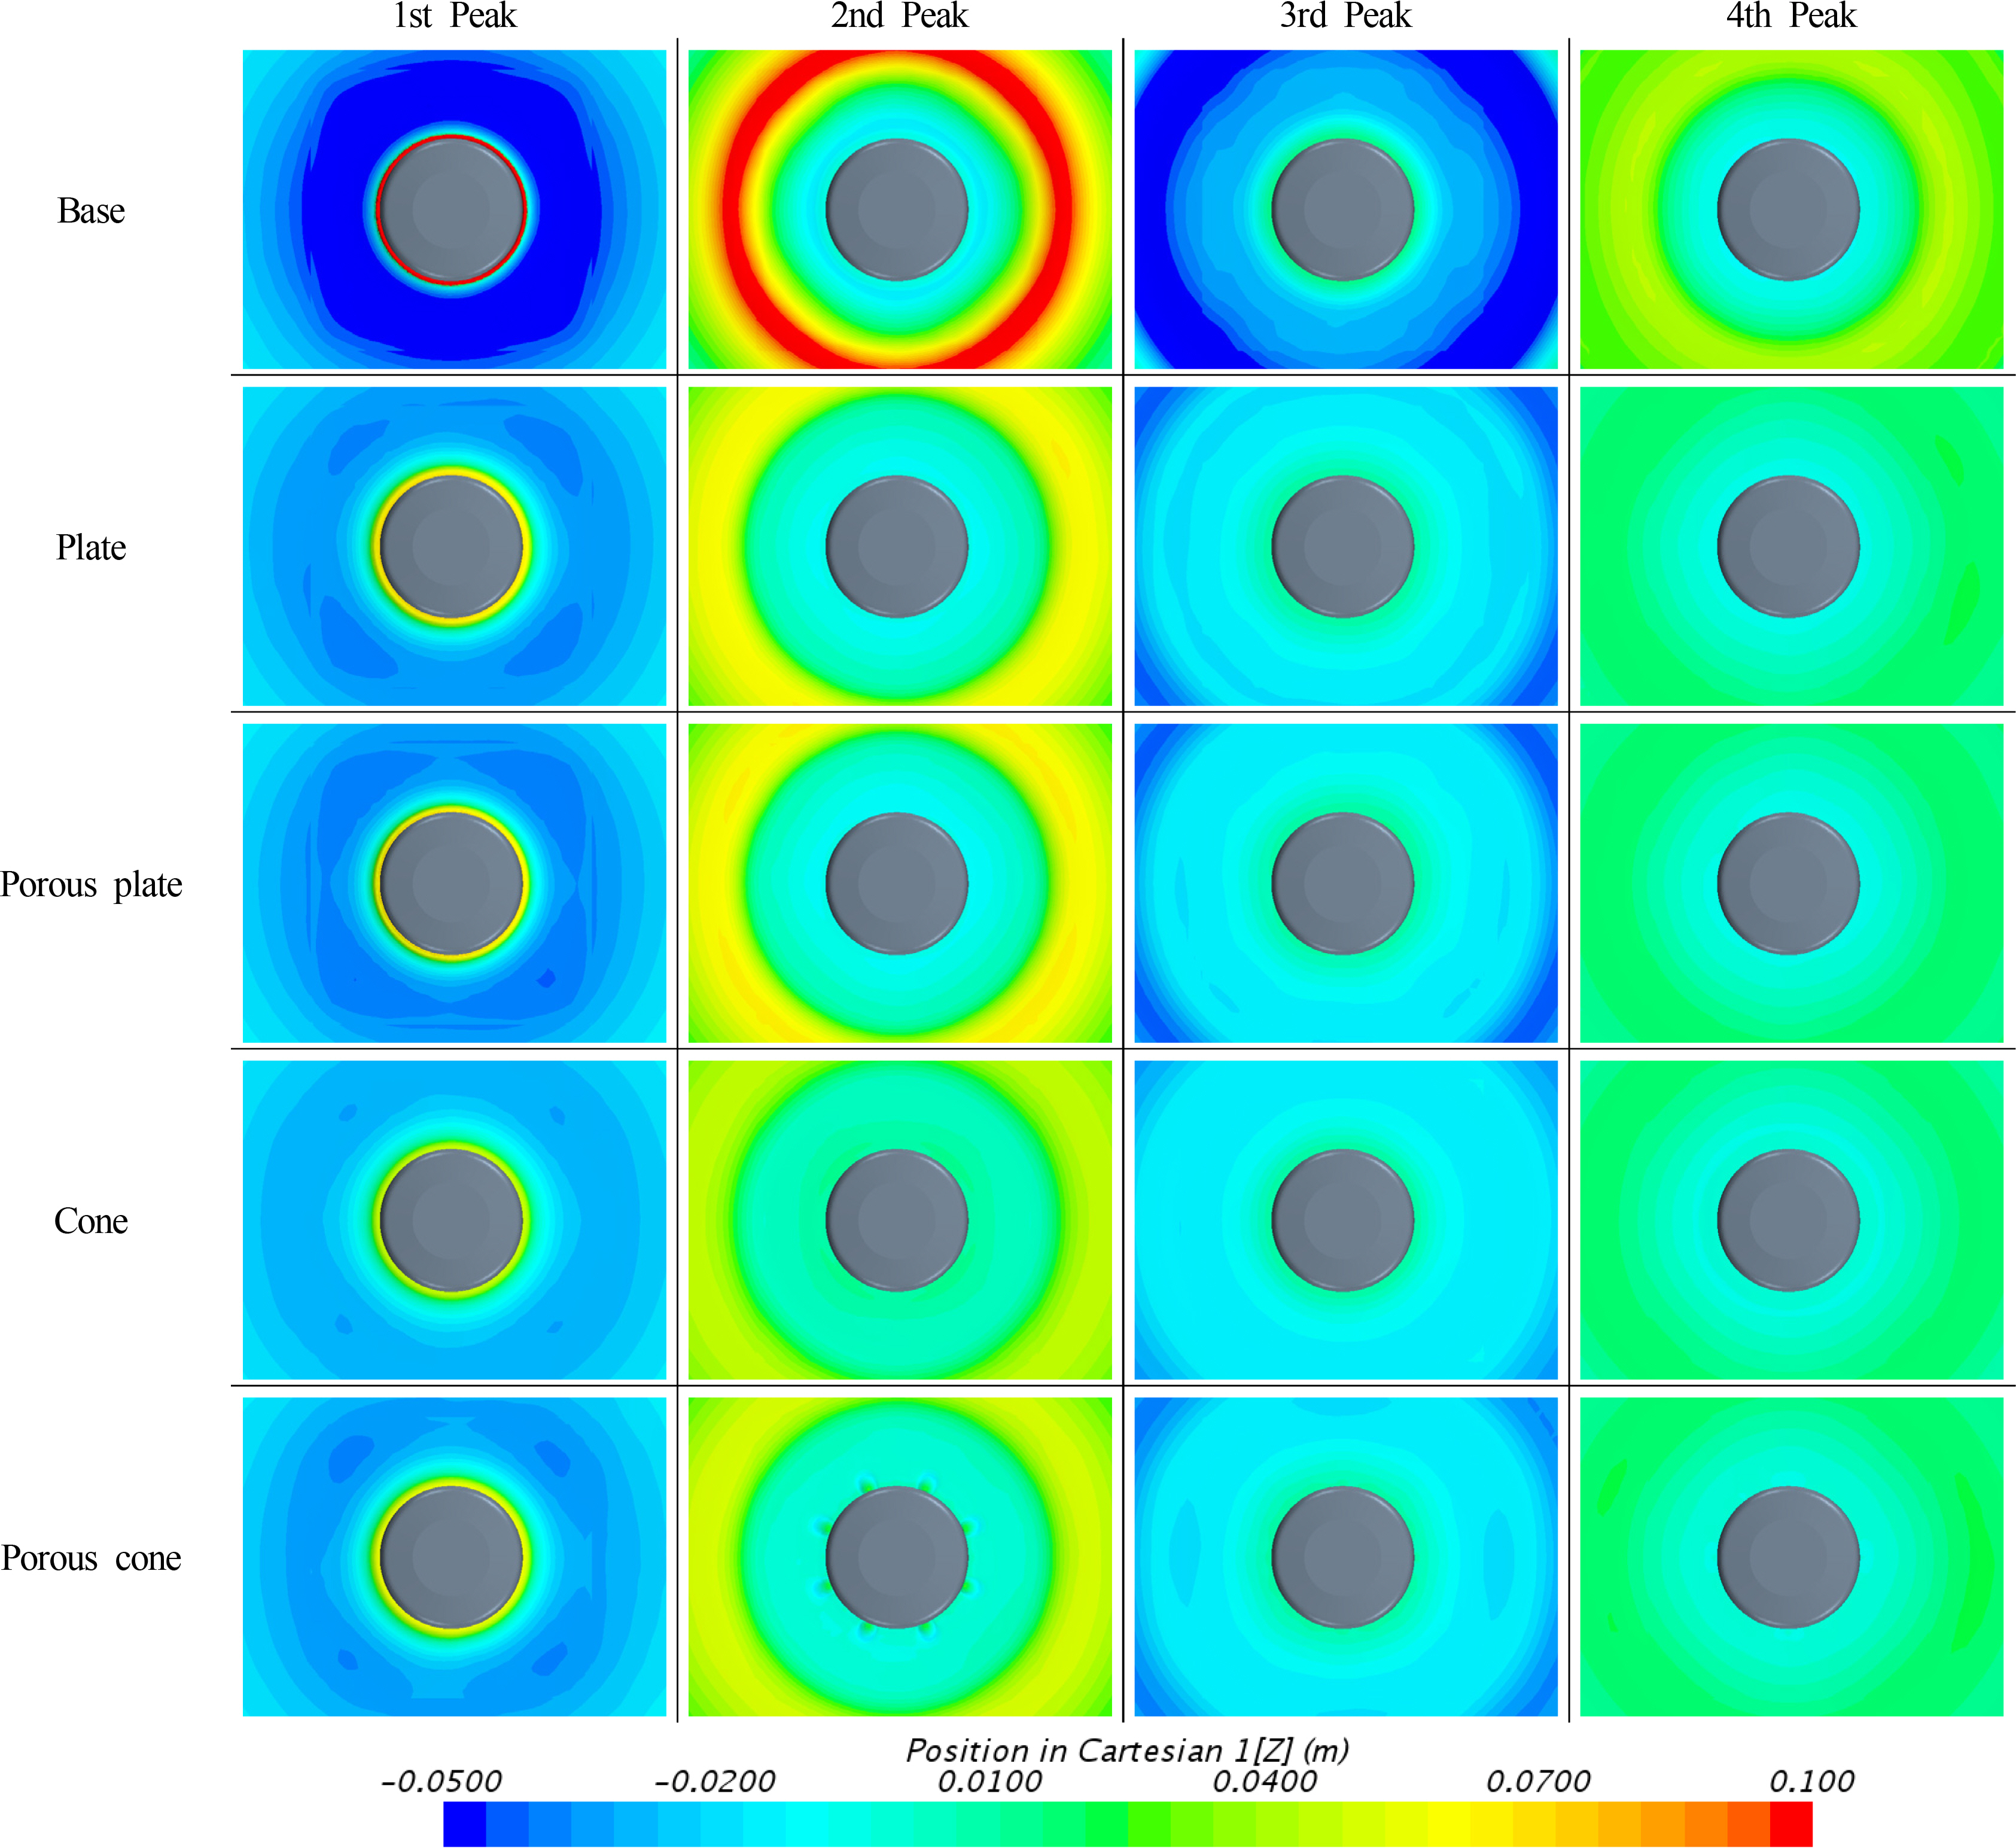
  2. A CFD simulation of the free decay of the pitch and heave was performed for the base model without any appendage and for the plate, porous plate, cone, and porous cone models with the appendages installed, and each viscous damping coefficient was calculated. The damping coefficient was estimated to be increased by the installation of the appendage. The viscous damping coefficient accounted for most of the pitch damping coefficient, and the viscous damping and radiation coefficients were estimated to be at equivalent levels in the heave damping coefficient.

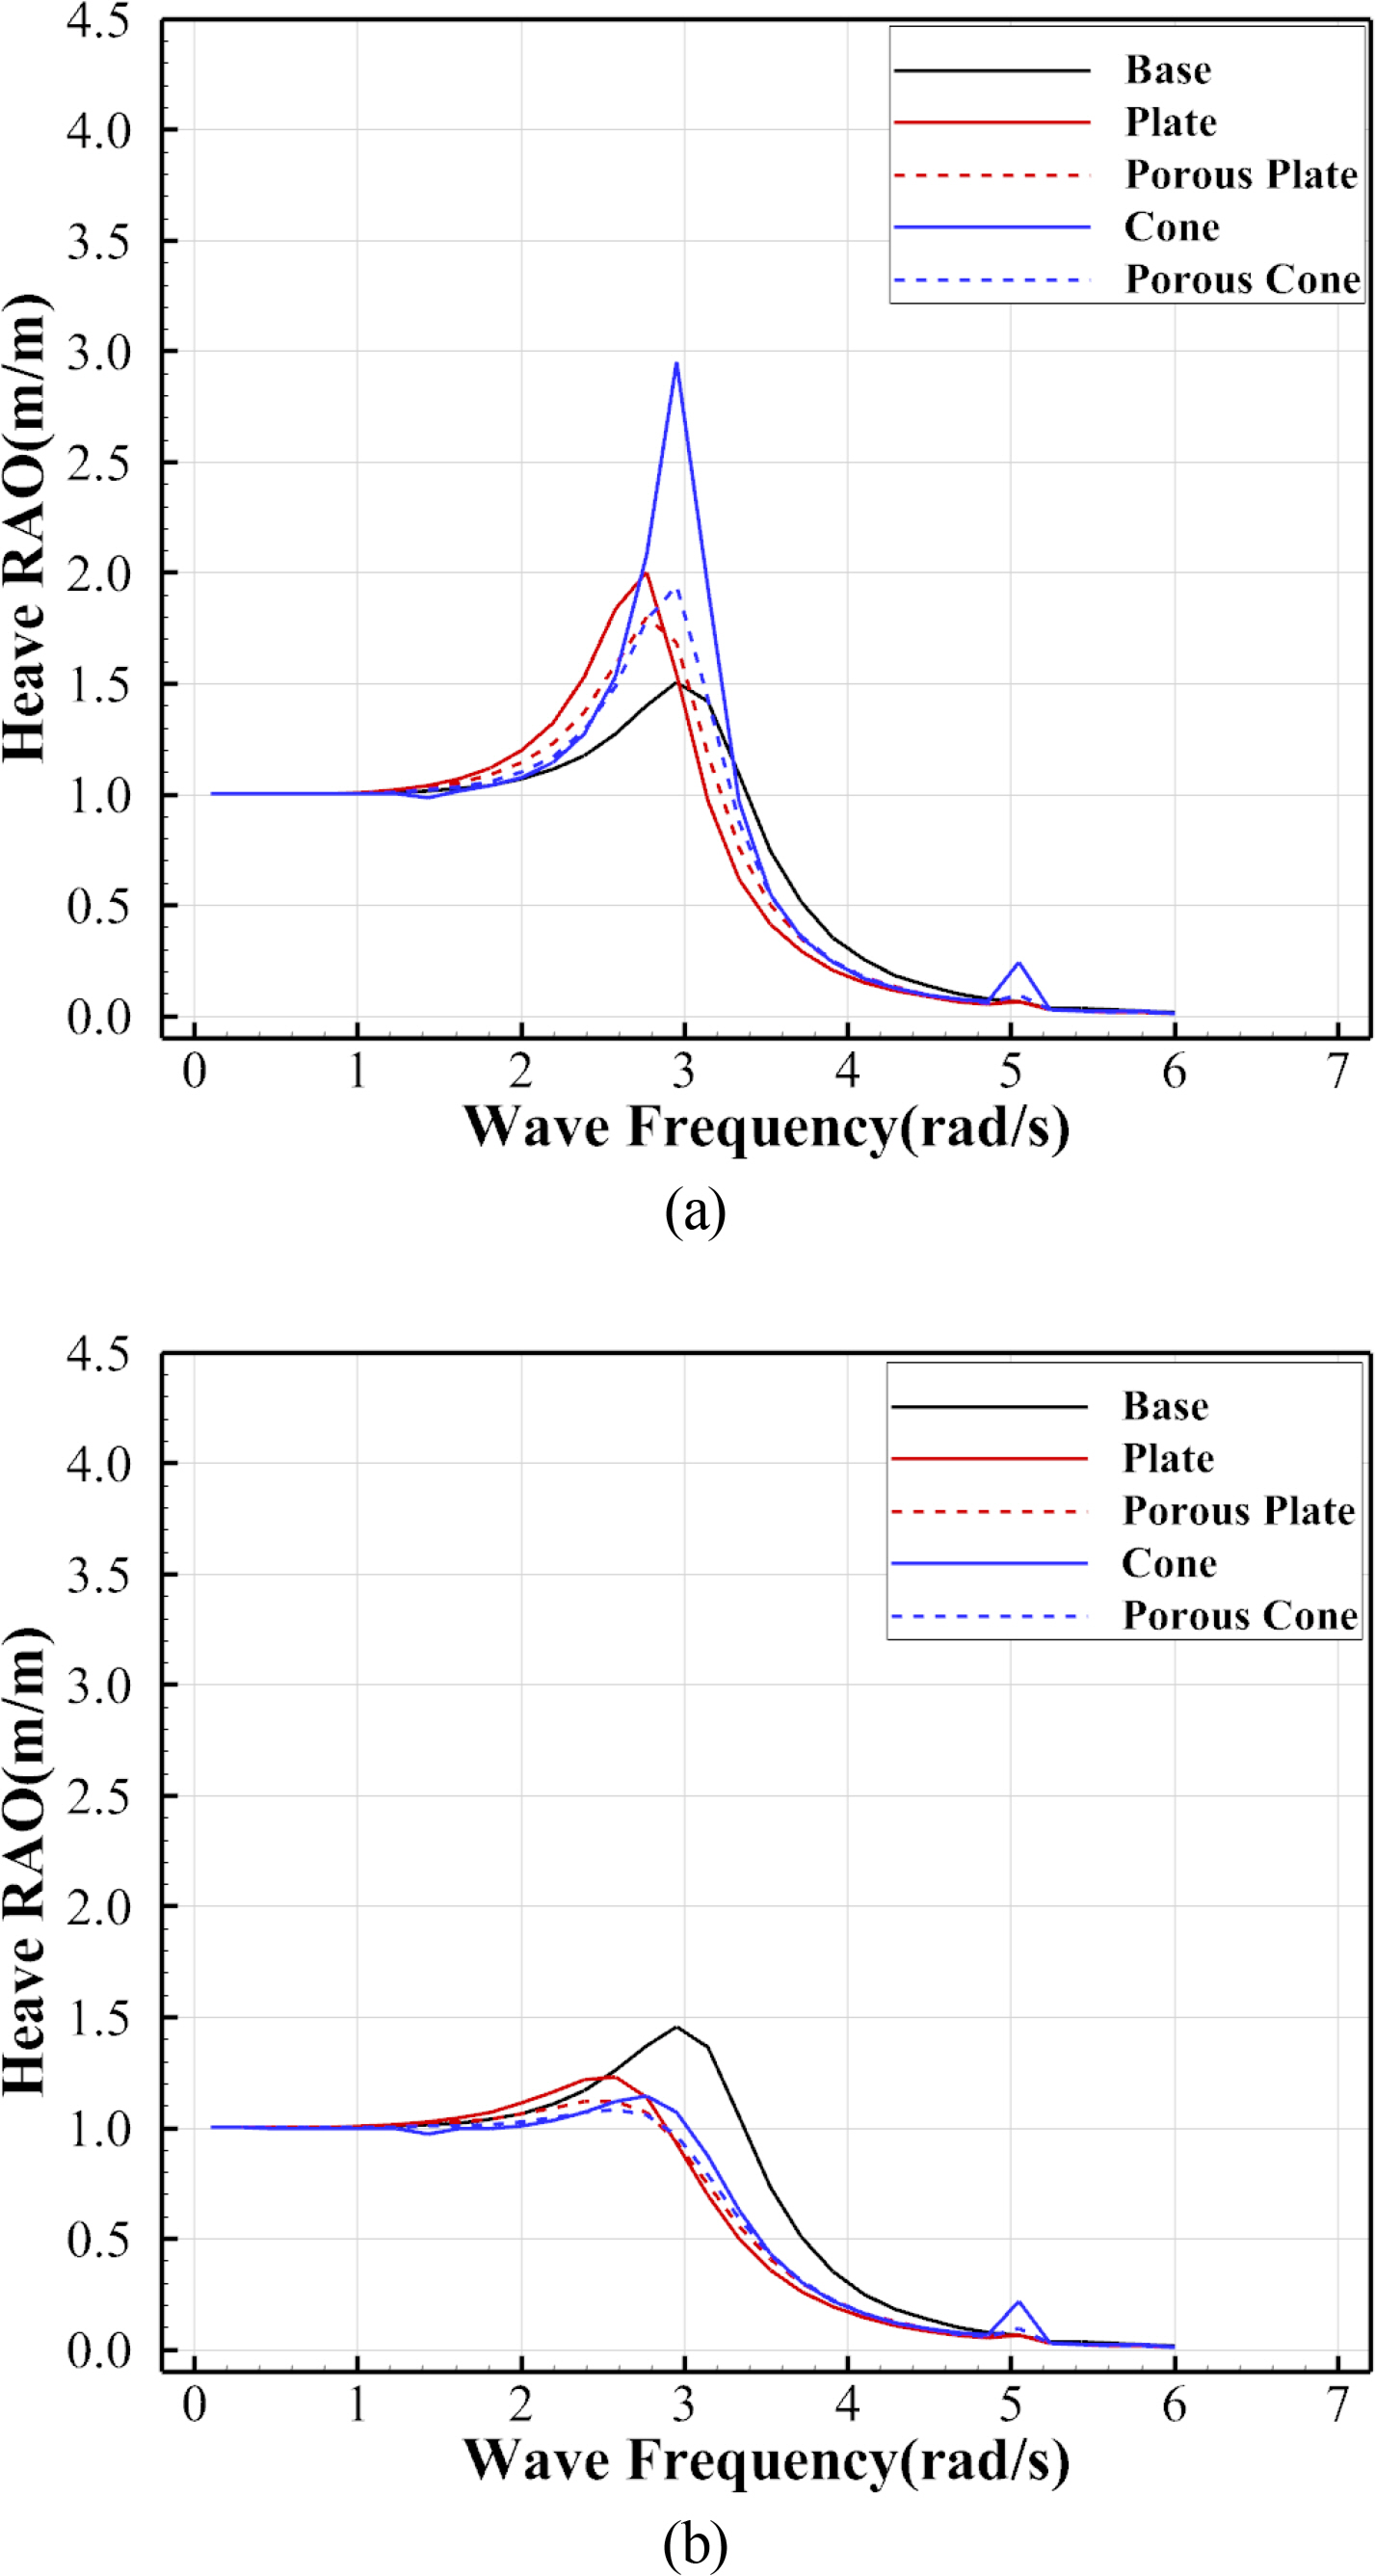
  3. Potential-based motion analyses of cases with and without considering the viscous damping coefficient calculated by CFD were performed, and the results were compared. When considering the viscous damping coefficient, the RAO was significantly reduced near the natural frequency of each model.

  4. The motion analysis of each model considering the viscous damping coefficient showed that the motion was reduced by the installation of the appendage. The maximum RAO values were estimated to have an ascending order of the porous plate, plate, porous cone, cone, and base for the pitch, and the ascending order of the porous cone, porous plate, cone, plate, and base for the heave.

The results of this study are expected to be used as basic data for analyses of the motion performances of marine structures such as spar platforms (circular cylinder type) and wave energy converters (WECs) as well as light buoys. The results will be compared to the results obtained from CFD single simulations in the future.

Notes

Author name ORCID Contributions
Son, Bo-Hun 0000-0001-8635-3787 ②③
Jeong, Se-Min 0000-0001-9252-1273 ①④⑤
① Conceived of the presented idea or developed the theory
② Carried out the experiment or collected the data
③ Performed the analytic calculations or numerical simulations
④ Wrote the manuscript
⑤ Supervised the findings of this study

Fig. 1.
Schematic flow chart of present study
joet-34-2-66f1.jpg
Fig. 2.
Free decay curves for grid convergence test
joet-34-2-66f2.jpg
Fig. 3.
Comparison of free decay curves between present CFD results and those of reference (Palm et al., 2016)
joet-34-2-66f3.jpg
Fig. 4.
Geometries of target light-buoys without and with developed appendage
joet-34-2-66f4.jpg
Fig. 5.
Geometries of simplified light-buoys without and with developed appendage
joet-34-2-66f5.jpg
Fig. 6.
Computational domain and boundary conditions
joet-34-2-66f6.jpg
Fig. 7.
Grid system for free decay test of light buoys
joet-34-2-66f7.jpg
Fig. 8.
Comparison of pitch decay curves of light buoys without and with appendages
joet-34-2-66f8.jpg
Fig. 9.
Comparison of vorticity around light buoys without and with appendages during pitch free decay test
joet-34-2-66f9.jpg
Fig. 10.
Comparisons of wave elevation around light buoys without and with appendages during pitch free decay test
joet-34-2-66f10.jpg
Fig. 11.
Comparison of heave decay curves of light buoys without and with appendages
joet-34-2-66f11.jpg
Fig. 12.
Comparison of vorticity contours around light buoys without and with appendages during heave free decay test
joet-34-2-66f12.jpg
Fig. 13.
Comparison of wave elevations around light buoys without and with appendages during heave free decay test
joet-34-2-66f13.jpg
Fig. 14.
Pitch RAOs of light buoys (a) without and (b) with considering viscous damping
joet-34-2-66f14.jpg
Fig. 15.
Heave RAOs of light buoys (a) without and (b) with considering viscous damping
joet-34-2-66f15.jpg
Table 1.
Comparison of natural frequencies and non-dimensional damping coefficients between present CFD results and those of reference (Palm et al., 2016)
Natural frequency, ω (rad/s) Non-dimensional damping coefficient, ζ (−)

Exp Palm et al. (2016) CFD Palm et al. (2016) CFD Present Exp Palm et al. (2016) CFD Palm et al. (2016) CFD Present
Pitch 5.370 5.595 5.518 0.028 0.042 0.038
Heave 5.650 5.712 5.794 0.090 0.108 0.095
Table 2.
Main particulars and hydrostatic properties of light buoys without and with appendages
Base Plate Porous plate Cone Porous cone
Mass (kg) 2,423 2,596 2,579 2,617 2,597
Diameter (m) 2.40
Draft (m) 3.036 3.073 3.069 3.078 3.073
Center of gravity (m) 2.136 2.009 2.021 2.150 2.149
GM (m) 1.052 1.144 1.137 1.018 1.021
Mass moment of inertia (kg·m2) 10,902 11,490 11,435 10,965 10,958
Table 3.
Predicted non-dimensional pitch damping coefficients and natural frequencies of buoys without and with appendages
ζ (−) Relative increment of ζ (%) ω (rad/s)
Base 0.0135 - 1.397
Plate 0.0209 54.89 1.452
Porous plate 0.0219 62.37 1.447
Cone 0.0167 23.44 1.425
Porous cone 0.0172 27.31 1.418
Table 4.
Predicted non-dimensional heave damping coefficients and natural frequencies of buoys without and with appendages
ζ (−) Relative increment of ζ (%) ω (rad/s)
Base 0.1107 - 3.107
Plate 0.1550 39.97 2.748
Porous plate 0.1660 49.99 2.813
Cone 0.1344 21.37 2.649
Porous cone 0.1587 43.37 2.795
Table 5.
Coefficients of added mass moment of inertia, viscous and radiation damping, and ratio of viscous damping to whole damping for pitch motion at natural frequencies of buoys
a55 (kg·m2) b55,vis (kg·m2/s) r55(ωo) (kg·m2/s) b55,visB55()
Base 1,968 63.359 0.488 0.9924
Plate 2,435 109.952 0.884 0.9920
Porous plate 2,556 114.261 0.842 0.9927
Cone 2,145 80.067 0.656 0.9919
Porous cone 2,116 82.690 0.610 0.9927
Table 6.
Coefficients of added mass, viscous and radiation damping, and ratio of viscous damping to whole damping for heave motion at natural frequencies of buoys
a33 (kg) b33,vis (kg/s) r33(ωo) (kg/s) b33,visB33()
Base 2,254 136 3,107 0.0419
Plate 2,874 2,243 2,890 0.4368
Porous plate 3,166 2,387 2,987 0.4441
Cone 2,549 2,907 1,710 0.6295
Porous cone 2,609 2,570 2,600 0.4970

References

Bhattacharyya, R. (1978). Dynamics of Marine Vehicles. New York. Wiley.

Hong, KY., Yang, CK., & Choi, HS. (2001). An Experimental Method for Analysis of the Dynamic Behavior of Buoys in Extreme Environment. Journal of Ocean Engineering and Technology, 15(3), 134-141.

Jeong, DS., Jeong, SM., Jeong, SS., & Yang, JH. (2017). Stability Evaluation of a LL-24-type Lightweight Light-Buoy Adopting EPP. Journal of Advanced Engineering and Technology, 10(2), 297-303.
crossref
Journée, JMJ., & Massie, WW. (2001). Offshore Hydromechanics. Lecture notes. Netherlands. Delft University of Technology.

Kim, MG., Jung, KH., Park, SB., Lee, GN., Park, IR., & Suh, SB. (2019). Study on Roll Motion Characteristics of a Rectangular Floating Structure in Regular Wave. Journal of Ocean Engineering and Technology, 33(2), 131-138. https://doi.org/10.26748/KSOE.2019.009
crossref pdf
Kim, NW., Kim, YJ., & Ha, YR. (2015). Experimental Study of the Free Roll Decay Test for the Evaluation of Roll Damping Coefficients. Journal of the Society of Naval Architects of Korea, 52(6), 460-470. https://doi.org/10.3744/SNAK.2015.52.6.460
crossref pdf
Ko, HS., Bae, YH., & Cho, IH. (2018a). Dynamic Analysis of a Floating Structures Using OpenFOAM. Journal of Computational Fluids Engineering, 23(1), 101-112.
crossref
Ko, HS., Cho, IH., & Bae, YH. (2018b). Non-linear Dynamic Analysis of an Eccentrical Cylinder-type Wave Energy Converter Using OpenFOAM. Journal of Computational Fluids Engineering, 23(3), 18-26. https://doi.org/10.6112/kscfe.2018.23.3.018
crossref
Koh, HJ., & Cho, IH. (2016). Heave Motion Response of a Circular Cylinder with the Dual Damping Plates. Ocean Engineering, 125, 95-102. https://doi.org/10.1016/j.oceaneng.2016.07.037
crossref
Koh, HJ., Kim, JR., & Cho, IH. (2013). Model Test for Heave Motion Reduction of a Circular Cylinder by a Damping Plate. Journal of Ocean Engineering and Technology, 27(4), 76-82. https://doi.org/10.5574/KSOE.2013.27.4.076
crossref pdf
Palm, J., Eskilsson, C., Paredes, GM., & Bergdahl, L. (2016). Coupled Mooring Analysis for Floating Wave Energy Converters using CFD: Formulation and Validation. International Journal of Marine Energy, 16, 83-99. https://doi.org/10.1016/j.ijome.2016.05.003
crossref
Son, BH., Ko, SW., Yang, JH., & Jeong, SM. (2018). Motion Analysis of Light Buoys Combined with 7 Nautical Mile Self-Contained Lantern. Journal of the Korean Society of Marine Environment & Safety, 24(5), 628-636. https://doi.org/10.7837/kosomes.2018.24.5.628
crossref
Suk, J., Kim, SY., Yang, YJ., Jin, SH., & Park, JC. (2016). A Study for Roll Damping Performance of a Platform Supply Vessel with or without Bilge Keel Using CFD. Journal of the Korean Society of Marine Engineering, 40(9), 791-798. https://doi.org/10.5916/jkosme.2016.40.9.791
crossref


ABOUT
BROWSE ARTICLES
ARTICLE CATEGORY

Browse all articles >

PUBLICATION ETHICS
FOR CONTRIBUTORS
Editorial Office
President Office BD Rm. 1302, 13 Jungang-daero 180beon-gil, Dong-gu, Busan 48821, Republic of Korea
Tel: +82-51-759-0656    Fax: +82-51-759-0656    E-mail: ksoehj@ksoe.or.kr                

Copyright © 2024 by The Korean Society of Ocean Engineers.

Developed in M2PI

Close layer
prev next